After some motivation from various researchers on Twitter: why don't we put studies we know won't be published on the internet somewhere..., I decided I would put my thesis up. Until I can re-analyze the new data I collected & actually attempt to have this thing published, of course. In the mean time, feel free to fill your mind and your time.
If you are lucky enough to have access, the full document can be found here or here.
ABSTRACT
Sexual
behavior and activity began to lose its sole purpose as sex for reproduction
early in the evolution of the genus Homo (Benagiano
et al., 2007). Consequently, humans have tried to utilize contraception ever
since they could document their existence. When used correctly, contraceptives
are enormously effective at preventing unintentional pregnancy. However, most
studies conducted on contraceptive behaviors have not been driven by theory.
The purpose of this research was to apply a theory to predict the contraceptive
use of females. Since life history theory is concerned predominantly with the
timing of reproduction, being that it is the final stage organisms can allocate
resources to in their lifetime (Griskevicius et al., 2011), life history theory
was applied for the current research. Participants (N = 283) completed surveys regarding their life history strategies
and contraception behaviors. Results revealed a two-factor solution that
represented r and K strategies. Multiple hierarchical regressions were utilized
to determine if the K and r strategy measures independently predict the
contraceptive measures as well as relevant life history outcomes. Although
lacking significance, results trended in the hypothesized direction. Results
did significantly predict a few relevant life history outcomes, including age,
delay of sex, sex frequency in the past year, religiosity, and current health.
Conclusions regarding future applications of this study’s measurement of
contraceptive effectiveness and the two-factor solution for measurement of life
history strategies are discussed.
Predicting Female Contraceptive Use: An Application of Life History Theory
Reproductive strategies of humans changed dramatically from
that employed by some of our common ancestors, for whom sexual activity was
restricted to sex for reproduction (Benagiano, Bastianelli, & Farris,
2007). Conceptive sex still remains as a valid reason for copulation; however,
non-conceptive copulations in primates are well documented. Bonobos (Pan paniscus), a species of chimpanzee, engage
in two distinct non-conceptive copulations: exchange sex, in which a female
acquires non-reproductive resources, and communication sex, sexual activity to
develop social relations or to reduce strain and aggression among group members
(deWaal, 1987). As illustrated by bonobos, sexual behaviors incorporate another
facet of sexuality that is considered typical
of sexuality in human beings: sexual behavior becomes something that can be
employed for reasons other than reproduction (Benagiano et al., 2007). These
findings suggest that sexual behavior and activity began to lose their sole
purpose as sex for reproduction early in the evolution of the genus Homo (Benagiano et al., 2007). Once “men
and women were able to separate with fairly high accuracy the ‘reproductive’
from the ‘non- conceptive’ aspects of reproduction, a real sexual revolution
took place” (Benagiano, Carrara, & Filippi, 2010, p. 97). This sexual
revolution occurred long before that of the 1960’s.
Contraception
Humans have tried to utilize contraception ever since they
could document their existence. Coitus interruptus,
withdrawal with ejaculation afterwards, was performed since ancient times. In
the 19th century, individuals started to monitor fluctuations in basal body
temperature and changes in cervical
mucus consistency to time ovulation;
implementation of these combined indicators was used for natural family
planning. In ancient Egypt and Rome, a device soaked with different extracts,
juices, lactic acid, or honey was placed in the vagina to prevent women from
conceiving; these recipes, noted in the Kahun Papyrusm, date as far back as
1850 BC. Three thousand years ago, dung from elephants or crocodiles was used
in India and Egypt to be introduced in the vagina prior to intercourse, acting
as an unsophisticated barrier and perhaps as spermicide. A physician was purported to have invented the condom between
1660-1685 for King Charles II, who was stricken with a large number of
illegitimate offspring. Since the 18th
century, condoms made of cloth or animal by-products including skin or
intestinal tissue were mass-produced. The 19th century brought
rubber condoms while the 20th century brought latex condoms (Li
& Lo, 2005).
The notion of placing a foreign object in the
uterus was first portrayed in fabled stories about African nomads who put tiny
stones into the uterus of their camels to prevent conception during lengthy
journeys. After ascertaining the anti-fertility effect of
intrauterine copper ions in rabbits, the first copper-T IUD was introduced in
1969. Exchanging the copper with progesterone
or levonorgesterol offered surplus non-contraceptive benefits, such as
decreasing pelvic infections (Li & Lo, 2005; Szarewski &
Guillebaud, 1991).
It was not until the turn of the 20th
century that we gained knowledge of reproductive endocrinology that would
eventually lead to applications in modern hormonal contraception. In the 1920s
administration of estrogen would render experimental animals infertile; in the
1930s both estrogen and progesterone caused anovulation. Through the hard work
of several renowned researchers in steroid chemistry, synthetic progesterone
and estrogen were produced (Szarewski
& Guillebaud, 1991). The first combined oral
contraceptive preparation, called Enovid was available in 1959, but the
estrogen dosage was high compared to pills used today (Szarewski &
Guillebaud, 1991).
The lower dose ethinyl-estradiol pills were available since 1961 and
even lower dose pills were in regular use since 1972 (Li & Lo,
2005).
Depo-Provera was the first injectable hormone developed and
it was approved for contraceptive purpose in the mid-1960s. Norplant was the
first contraceptive implant approved in 1984 as a multi-rod subdermal implant. A single-rod implant, Implanon, was launched in 1998. The
latest hormone delivery methods, specifically the transdermal patch,
Ortho-Evra, and the vaginal ring, NuvaRing, have been recently introduced as
different mechanisms of hormonal contraceptive transmission (Li & Lo,
2005).
Since
the earliest times, unusual ploys such as sneezing and vaginal douching with
diverse substances such as lemon juice or Coca-Cola have been used for
post-coital contraception. The modern hormonal method for emergency
contraception (EC) probably started in the 1920s when post-intercourse
administration of estrogen in animals prevented pregnancy; the first account of
EC use for humans was in the early 1960s, when high-dose diethylstilbestrol was
administered (Li &
Lo, 2005). Sterilization
for both men and women is also a very effective form of contraception and has
replaced the Pill as the most used method for women over thirty (Szarewski
& Guillebaud, 1991).
Contraceptive Facts
As of July 2012, 62 million women in the United States are
between the ages of 15-44: women who are sexually active and able to bear
children (Centers for Disease Control, 2009).
Individuals who did not apply a contraceptive method had an 85% chance
of becoming pregnant in the past year, intended or not (Trussell, 2011). One in
ten females are at risk for an unintended pregnancy, the highest proportion of
women being adolescents, between 15 and 19 year olds. Ninety-two percent of
women with at least a bachelor’s degree are currently using a contraceptive
method, compared to only 89% of females who do not have a high school diploma
(Mosher & Jones, 2010). Only 88% percent of women living below the
federal poverty line are using contraceptives, compared to 92% of women living
above the poverty line (Mosher & Jones, 2010).
Fifty-four percent of 2.9 million teenage women rely on the
pill as their primary method of contraception (Mosher & Jones, 2010). The
pill is one of the most effective methods, with an eight percent failure rate
with typical use (Trussell, 2011). When
used correctly, contraceptives are enormously effective at preventing
unintentional pregnancy. Females who use contraceptives consistently and
correctly account for only 5% of unplanned pregnancies (Gold, Sonfield,
Richards, & Frost, 2009). Using contraception consistently and correctly is
equated to having high contraceptive use skills. If an individual uses
contraception consistently and correctly, not only are they more skilled at
using the contraception, they are more skilled at preventing pregnancy. Several
hormonal methods, such as the pill, patch, vaginal ring, IUD, and implant
provide numerous health benefits beyond just preventing pregnancy. Prevention
of pregnancy is cited as the most common reason for using oral contraceptives
like the pill; however, over half of pill users also mention the additional
health benefits, including treatment for excessive menstrual bleeding, pain
associated with menstruation, or acne as reasons for use (Jones, 2011).
Less than 10% of women of reproductive age use a dual-method
(most often the condom in addition to another method; Eisenberg, Allsworth,
Zhao, & Peipert, 2012). Use of emergency contraception is a technique to
avoid pregnancy after unprotected intercourse or contraceptive failure
(Trussell & Raymond, 2011). Only one percent of women of reproductive age
have used emergency contraception. The age group with the highest possibility
for accidental pregnancy, females aged 18–29, are more apt than other aged
women to have used emergency contraception, which is considered a backup method (Frost, Henshaw, &
Sonfield, 2010). Again, emergency contraception is viewed as a method to use in
cases where other methods during or prior to intercourse were not
employed.
Knowledge about contraceptive methods is a robust predictor
of use. Of unmarried women aged 18–29, for every correct response on a
contraceptive knowledge scale, the likelihood of currently using a hormonal or
long-acting reversible method (i.e., the most effective methods) increased by
17%, and of using no method decreased by 17% (Frost, Lindberg, & Finer, 2012).
If an individual knows more about contraception, specifically the information regarding
effectiveness of each method, they are more likely to choose the most effective
method as their own method. Interestingly, 19% of women perceive they are
infertile, regardless of whether this belief is medically supported (Polis &
Zabin, 2012). This could explain the frequency of unplanned pregnancies within
this population if proper contraceptive methods are perceived as not needed and
thus not utilized.
Correlates of Contraceptive Use
Most studies conducted on contraceptive behaviors have not been
driven by theory. Previous studies have examined a multitude of factors correlated
with contraceptive behaviors. For example, one-third of women did not use
contraception because they believed they could not get pregnant at the time of
intercourse (Nettleman, Chung, Brewer, Ayoola, & Reed, 2007). If a woman doesn’t
think there was a risk of pregnancy during intercourse, she wouldn’t employ a
method. Another study revealed about 50% of coital events would be protected if
women expressed that they were committed to not becoming pregnant (Bartz, Shew,
Ofner, & Fortenberry, 2007). If a woman was explicitly devoted to
preventing pregnancy, she would be committed to protecting herself for at least
half of her coital events. Furthermore, if women reported that they communicate
with their sexual partners about contraceptive choices and issues infrequently,
they would be inconsistent contraceptive users (Davies et al., 2006). Also, increased
relationship quality was associated with decreased condom use (Sayegh,
Fortenberry, Shew, & Orr, 2006).
In addition, Asian, Latina, African American women and women
who were raised with a religion are less likely to use any contraceptive method
(Raine, Minnis, & Padian, 2003;
Kost, Singh, Vaughan, Trussell, & Bankole, 2008). Contraceptive failure
risk most severely affects the poorest females, women living below the 100%
poverty level (Kost et al., 2008). These women might have to rely on more
affordable, less effective methods, which are more likely to fail. Cultural
beliefs, values, and influences of the individual’s surrounding community can act
as barriers for the female to obtain contraceptives (Sable et al., 2000). Frequent discussions with friends about
contraceptives foster positive attitudes towards contraception and increased
satisfaction (Forrest & Frost, 1996).
Transportation often affects women’s abilities to obtain
contraception; women who had no insurance cite transportation difficulties as a
barrier more often than insured females (Sable, Libbus, & Chiu, 2000). If a
woman’s community isn’t as accepting of contraceptive behaviors, this might
stigmatize women attempting to prevent pregnancy; consequently, they might not
be able to obtain their preferred method. Method satisfaction is most likely in
women who acknowledge the pill’s non-contraceptive benefits, experienced few to
no side effects, and had used the pill previously (Rosenberg, Waugh, &
Burnhill, 1998). African Americans
report lower use of hormonal contraceptives and increased rates of sexually
transmitted infections, while Caucasians are less likely to use condoms for
intercourse (Buhi, Marhefka, & Hoban, 2010).
Likewise, African American students show an increased
incongruence in using effective methods of contraception compared to Caucasian
students (Gaydos, Neubert, Hogue, Kramer, & Yang, 2010). Abused women do
not use their preferred method compared to non-abused women (Williams, Larsen, &
McCloskey, 2008). Furthermore, research conducted on contraceptive behaviors
remains predominately located within the health fields (Skouby, 2010; Frost
& Darroch, 2008; Buhi, Marhekfa, & Hoban, 2010; Gaydos et al., 2010;
Ersek, Huber, Thompson, & Warren-Findlow, 2011).
It is somewhat apparent that predominately, the studies
conducted on contraceptive behaviors are not driven by theory. Upon further
examination of the variables correlated with contraceptive behaviors, one theory
that is a likely candidate for application in this area of research is life
history theory (LHT).
Life History Theory Literature
Charles Darwin proposed the theory of evolution by natural
selection over 150 years ago (Darwin, 1859). It has only been in the past 20
years that the psychological, social, and behavior sciences have integrated the
principles of evolution already deeply incorporated in biology and ecology. The
goal of evolutionary psychology is not only to incorporate evolutionary
biology, anthropology, neuroscience, and cognitive psychology to map human
nature, but also to rewrite existing literature, reframing previous efforts
into an evolutionary perspective (Tooby & Cosmides, 1992). It is worth
mentioning that evolutionary psychology is not to be acknowledged as a subset
of psychology, like social psychology or cognitive psychology, but rather as “a
way of thinking about psychology,” available as a lens for viewing any topic
therein (Cosmides & Tooby, 2000, p. 1). One evolutionary approach to the
study of individual differences is life history theory (LHT). Initially, biologists
and zoologists used life history theory to study species differences in
reproductive strategies (Promislow & Harvey, 1990, 1991).
Evolution is the outcome of a process in which
organisms compete to acquire resources from the environment to produce
offspring (Kaplan & Gangestad, 2004). Individual organisms “‘capture’
energy from the environment (through foraging, hunting, or cultivating) and
‘allocate’ it to reproduction and survival-enhancing activities” (Kaplan &
Gangestad, 2004, p.2). Selection will favor individual organisms that
efficiently capture resources and effectively allocate these resources to
increase fitness within their environment. Resources are not free; in reality,
individuals must live within fixed resource budgets, only spending what is
available. Allocation of a fixed budget necessitates trade-offs and
consequently, decisions must be made about the ways to spend this budget. Essentially,
LHT provides a framework addressing how individuals allocate resources to tasks
that maximize fitness in the presence of trade-offs. Allocations vary across
the lifespan and, consequently, LHT is concerned about the evolutionary forces
that shape the scheduling of events involved in growth, maintenance, and
reproduction (Kaplan & Gangestad, 2004).
Gadgil and Bossert (1970) established the first
modern LHT framework, hypothesizing tradeoffs as fixed resource budgets.
Organisms capture resources
from the environment, the rate at which they capture resources determines their
resource budget, and they can spend their resource budget on three distinctly
different behaviors: growth, maintenance, and reproduction. Through growth, individuals can increase
their resource capture rates for the future, thus maximizing future fertility;
organisms typically have an adolescent stage in which reproduction is not
possible and the primary resource allocation is on growth. Through maintenance, individuals repair
tissue and allocate resources to increase immune function. Through
reproduction, or reproductive effort,
individuals replicate their genes into offspring (Gadgil & Bossert, 1970).
Deciding whether to spend resources on current reproduction versus future reproduction is at the heart of the
somatic effort versus reproductive effort compromise. Somatic effort is
akin to investing in one’s self and reproductive effort is akin to spending
those investments that will allow for gene replication. Investment in somatic
effort is investing in future reproduction (Griskevicius, Delton, Robertson,
& Tybur, 2011). Individuals do not invest in themselves (somatic effort) as
an end in itself; rather, they invest for the sake of future reproduction. This
is exemplified in the individual that postpones reproduction immediately after
puberty, attends a university, acquires a degree, becomes employed where she or
he can accrue financial stability, and then finally decides to reproduce; with
the increased financial stability and higher education, this individual can
invest heavily in her or his offspring. Resources allocated to somatic effort, including the
growth and maintenance of body and mind and the accumulation of embodied
capital, cannot concurrently be allocated to reproductive effort, including sexual competition,
gestation, and birth (Griskevicius et al., 2011).
A second dilemma is the allocation of
resources to mating effort or parental effort (Figueredo et al., 2006). The procurement
and retaining of mating partners is described as mating effort; that is, the
time spent looking for potential mates and the time spent keeping these mates
around until reproduction is successful. Enhancement of survival of offspring
is described as parental effort; that is, the time spent feeding, nurturing,
educating, and protecting offspring until they reach maturity. However, a
trade-off also exists between these two efforts. For example, effort spent
parenting cannot be spent acquiring new mates.
Within parental effort lies yet another
trade-off: offspring quality versus quantity. This fundamental trade off
assumes that resources are limited so as investment in one offspring increases,
investment in each other individual offspring decreases; increased investment
in offspring enhances the offspring’s reproductive success; and maternal
fitness is calculated by the quantity of offspring that reach maturity and
their ensuing lifetime reproductive success (Gillespie, Russell, & Lumma,
2008). Therein lies an evolved trade off for females between offspring quality
versus quantity (Lack, 1947). Although, in comparison to other species, humans
tend to favor quality over quantity in offspring, there are still individual
differences in this reproductive decision. Increased maternal embodied capital
increases child survival (Lawson et al., 2012). Birth, difficult and painful in
humans, is risky for both the fetus and the mother (Mace, 2000). Although risks
for maternal mortality are high and vary by region, risks to the baby are still
greater. The earlier a child is weaned, the greater the risk of infant
mortality (Mace, 2000); cessation of weaning is most likely due to impending
pregnancy. Again, the quality of offspring is threatened when quantity of
offspring increases. Offspring competition for resources is also a source of
risk and mortality; larger quantities of siblings competing for food leads to
decreased height in adolescence, further diminishing their future reproductive
success (Lawson et al., 2012).
Life
History strategies. How and when an individual decides to reconcile these resource
allocation trade-offs comprises that individual’s LH strategy (Griskevicius et
al., 2011; Gadgil & Bossert, 1970). Several environmental features influence LH
strategies; factors include harshness (e.g., the age and sex-specific rates of mortality),
unpredictability (e.g., the uniformity of harshness from one time to another),
and resource scarcity (e.g., the obtainability of resources and level of
competition for resources; Ellis et al., 2009). Species that
evolved in harsh, unpredictable, resource scarce environments are inclined to
implement distinctive LH strategies (Griskevicius et al., 2011). For example, a
species that evolved in a harsh and unpredictable environment will invest less
in somatic effort, reach sexual maturity quickly, and start reproducing at a
high rate; this fast strategy or r strategy is adaptive for members of such
species since reproducing quickly mitigates the risk of death without leaving
behind any offspring. These individuals invest in reproductive effort at the
cost of somatic effort. In contrast, investment in somatic effort heightens an
individual’s capacity to compete for mates and invest in offspring; a species
that evolved in a predictable environment follows a slower strategy or K
strategy, investing more in somatic effort and delaying reproduction
(Griskevicius et al., 2011). These individuals invest in somatic effort at the
cost of investment in current reproduction effort, opting for future
reproductive effort.
LHT can be exemplified by comparing the strategies
displayed by r-selected species, the fast individuals, which invest heavily in
reproduction with short life spans, with K-selected species, the slow
individuals, which invest heavily in their own development and that of their
offspring. Fast, r-selected species
evolved in unstable, harsh, and unpredictable environmental conditions, leading
to a strategy focused on producing high offspring quantity. Rabbits demonstrate
quick sexual development, low parental investment, short life expectancy, and high
competition for resources because they evolved in environments where short-term
strategies increased fitness.
Conversely, K-selected species evolved under stable and predictable
conditions, leading to a strategy focused on survival of high offspring
quality. Elephants demonstrate slow sexual development, high parental
investment, long life expectancy, and low competition for resources because
they evolved in stable environments where long-term strategies increased
fitness (Figueredo, Vasquez, Brumbach, & Schneider, 2004).
Humans are characteristically defined by the
substantial investments they make in somatic development at the cost of early
reproduction. Compared with chimpanzees, humans reach physical maturity much
later and reproduce at an even later age (Kaplan, Hill, Lancaster, &
Hurtado, 2000). Originally, comparative biologists concentrated on describing
LH strategies typical of a certain species, and then comparing the strategy of
that species with the strategy of another (Lack, 1950); accumulated evidence,
however, indicated adaptive within-species variation in LH strategies exist in
many taxa (Daan & Tinbergen, 1997; Tinbergen & Both, 1999). Organisms appear to implicitly monitor
current and expected states of their environments, regulating the LH strategies
they engage (Ellis et al., 2009). Instead of exhibiting a fixed strategy for
life, LH strategies show environmental exigency in reply to precise cues during
childhood and adulthood. According to LHT, the environmental factors linked to
different LH strategies in modern human environments are cues such as the local
mortality rate and the availability of resources in the local environment
(Kaplan & Gangestad, 2005; Quinlan, 2007; Worthman & Kuzara, 2005).
LHT suggests that since an individual’s resources are
limited, the individual must choose
between r and K strategies; the individual must choose to invest in their offspring or not, put off mating or not,
and have few or many offspring (Kruger & Nesse, 2004, 2006). According to
LHT, a continuum for humans exists from a slower course, high K, to a faster
course, low K (Bielby et al., 2007; Ellis et al.,
2009). An unpredictable and harsh environment, low investment from
mother and father when growing up, father absence, stepfather presence, low
social support, and high mortality risk are factors that contribute to the
manifestation of a low K strategy, similar to the r strategy of other species
(Figuredo et al., 2006). A predictable environment, high mother and father
nurturing while growing up, high social support, and low mortality risk are
factors that could contribute to the manifestation of a high K strategy
(Figueredo et al., 2006). These choices in strategy manifest in behaviors existing
within two clusters; mating strategies form a continuum, with most individuals
falling somewhere along this range (Figueredo et al.,
2004). The high K strategy involves clusters of behaviors such as
delayed puberty, slow sexual maturation, selective mating, sexual restraint,
extensive parental investment, consideration of risks, long lifespan, increased
inclusive fitness, extensive somatic investment, high cooperation, high
altruistic behaviors, monogamy, long term thinking, and intensive offspring
investment. The low K strategy involves clusters of behaviors such as preference
for sexual variety, sexual promiscuity, unrestrained sexuality, risk taking,
aggression, early puberty, quick sexual maturation, impulsivity, low romantic
attachment, low cooperation, rare altruistic behaviors, disregard of social
rules, manipulative, exploitative, short term thinking, and increased fecundity
(Figueredo et al., 2006).
The assumption, however, that an individual’s
resources are limited, forcing them to choose between traditional r and traditional
K strategies has been challenged. Rowe, Vazsonyi, and Figueredo (1997) state: “…it
may be possible for an unusually resource rich male to pursue a mixed strategy
combining certain elements of both” (p.106). It is reasonable to think that
individuals with limited resources are forced to choose between r and K
strategies, but individuals that have plentiful resources might be able to
exhibit traditional r and traditional K strategies. An individual with increased health, energy,
and wealth might be able to exhibit both traditional r and K strategy specific
behaviors simultaneously.
It is proposed that the traditional view of the K strategy
be maintained with respect to future time perspective, long-term mating
strategy, and environmental input. Concurrently, sexual drive, sexual desire, sexual
flexibility, and lack of sexual restraint (Figueredo et al., 2006) should be
removed from K and placed on a separate factor; this second factor could be
described as r. Figueredo and others (2006) include sexual restraint as
dimension of the K Factor: high K individuals are more likely to delay sexual
activity and engage in less risky sexual behaviors. Indicators of sexual
restrictedness include increased religiosity, endorsing value and health
reasons for abstaining from sex, perceived abilities to refuse sex, sexual
decision making skills, positive endorsement of teenage abstinence, acceptance
of norms prohibiting sex before marriage, intentions to abstain, and pro-social
behaviors (Figueredo et al., 2006; Brumbach, Walsh, & Figueredo, 2007). According
to this traditional view, high K individuals will experience sexual feelings
and attractions later than low K individuals; concurrently, low K individuals
will be more impulsive, sociable, risk-taking, and emotional in sexual
relationships compared to their high K counterparts (Figueredo et al., 2006). However,
this traditional view does not account for individuals that exhibit high K
strategies in non-sexual clusters of behavior while exhibiting traditional low
K strategies in sexual clusters of behavior. Individuals that show low “sexual
restraint,” such as engaging in intercourse at a younger age and more
frequently, can simultaneously engage in high K behaviors, such as attending a
university with long term career goals.
Life history theory is concerned predominantly with the
timing of reproduction, since that is the final stage organisms can allocate
resources to in their lifetime (Griskevicius et al., 2011). The question of how
individuals time their reproduction can be answered: they use contraception.
For example, many insist prior to the sexual revolution of the 1960’s that the
female’s only way of preventing pregnancy was by acting as a gatekeeper: to say
no to any unworthy mate; this however does not seem to make sense (see also
Ryan & Jethá,
2010; Pillard, 2007; Hayes & Carpenter, 2010; Wiederman, 2005; Schick,
Zucker, & Bay-Cheng, 2008). Humans have known the benefits of
non-conceptive sex since the beginning of the genus Homo (Benagiano et al., 2007; 2010). Our animal kingdom relatives
have also found ways to employ contraception in order to prevent pregnancy,
seen in wooly spider monkeys (Glander, 1994; Strier, 1993; Strier &
Ziegler, 1994), red colobus monkeys (Wasserman et al., 2012), and even
elephants (Shuker, 2001). Furthermore,
the history of contraception, contraceptive practices, and the extensive amount
of information collected on how to prevent pregnancy supports the notion that
women did not have to serve as gatekeepers (Meena & Rao, 2010; Li & Lo,
2005).
If women wanted to time their reproduction they would go to
great lengths to prevent pregnancy. Also, it does not seem logical for an early
human female to insert one of many of the previously mentioned substances into
her vagina (Li & Lo, 2005), a rather dangerous and sometimes deadly task,
just to keep her mate happy; her drive for sex must have been just as strong.
As previous literature has indicated, a traditionally high K woman that wished
to maintain her desires for future reproduction would have the only option of abstinence
(Buss & Schmitt, 1993). Humans however, are highly sexual; this is even
more apparent when researching all the methods of contraception that have ever
been invented and utilized.
In this light, a low sexually restrained woman isn’t forced
to life the life of a low K female: she can engage in high-K nonsexual clusters
of behavior and “low K” sexual clusters of behavior simultaneously. To that
end, a second factor must be examined. This new factor, r, is sexual clusters
of behavior. Humans have non-sexual clusters of behavior and sexual clusters of
behavior. Those sexual clusters of behavior are sex drive, attitudes towards
sex, sexual excitability, and sexual sensation seeking; those behaviors also
lie on a continuum. Individuals can be low in sexual restraint (r) or high,
just as much as they can be high or low on the K spectrum. With contraception,
individuals that engage in high r behaviors, such as engaging in intercourse at
a younger age and more frequently, can simultaneously engage in high K
behaviors, such as attending a university with long term career goals because
intercourse does not lead to reproduction.
Concluding, to
measure life history strategy on one continuum, with sexual and non-sexual
clusters of behavior within the single continuum, does not reveal the whole
picture of human life. Specifically, high K, high r individuals are being
missed. It is through the use of contraceptives females can pursue a mixed
strategy of combining both r and K strategies. Although women have been
practicing contraception since they could keep written records, it was only
recently that highly effective hormonal methods allowed women to almost perfect
their contracepting behaviors (Szarewski & Guillebaud, 1991). Since sex
with contraception lowers the risk of pregnancy, women can combine r and K
strategies. High K specific strategies such as high personal investment
(attending a university, pursuing a career, etc.), delay of reproduction, and
increased investment in offspring quality with birth spacing can be achieved by
utilizing an effective form of contraception. However, these women can also
engage in a high frequency of intercourse both inside and outside the context
of relationships, a strategy often displayed by high r individuals. On the
contrary, individuals that are seen as traditionally high K, possessing high
sexual restraint, would thus exhibit low r clusters of behavior: sex only for
reproduction and selective, restricted long-term mating (see Table 1).
Table 1
Hypothesized
results for contraceptive effectiveness
Strategy
|
High
K
|
Low
K
|
Low
r
|
Sex only for reproduction,
high sexual restraint, committed and not active. Selective, restricted long
term mating.
Method: very
effective birth control and highly skilled use (Purposeful Abstinence).
|
Non-normal population, not interested in sex, high sexual
restraint, and potential floor effect. Varied, unrestricted short term
mating.
Method: no
contraceptive method used since not engaging in sexual intercourse (Indifferent Abstinence).
|
High
r
|
Frequent sex for non-reproduction, low sexual restraint,
committed and very active. Selective, restricted long term mating.
Method: very
effective birth control and highly skilled use (pill, IUD, implant, shot,
etc.)
|
Frequent sex for non-reproduction, low sexual restraint,
promiscuous and very active. Varied, unrestricted short term mating.
Method: no
method, least effective method and low skilled use (withdrawal, fertility
awareness, etc.)
|
Contraception makes it possible for an individual to begin
sexual activity at an early age while investing in self-development (e.g.,
pursuing a college degree), to have sex with multiple partners without
conception, choose one long-term partner (with or without non-conception extra
pair copulation), and invest heavily in a limited number of children (due to
contraception’s child spacing and limiting benefits). Through contraception, females can pursue
promiscuous or committed sex; females can have as much sex without conception
as desired; and consequently, enjoy sex proximately without the ultimate
consequence of pregnancy.
Hypotheses
The purpose of this research is to
investigate the relationships between r and K strategies and the use of
contraception. Specifically, the
following hypotheses will be tested:
1.
An interaction between r
and K strategies will be found to predict method effectiveness, such that high r and high K women will
utilize the most effective methods.
2.
An interaction between r
and K strategies will be found to predict contraceptive knowledge, such that high r and high K women
will be most knowledgeable about contraception.
3.
An interaction between r
and K strategies will be found to predict general attitudes towards contraceptives, such
that high r, high K women will have the most positive attitudes.
4.
An interaction between r
and K strategies will be found to predict morality attitudes towards contraceptives, such
that high r, high K women will be the most morally accepting of contraceptives.
5.
An interaction between r
and K strategies will be found to predict contraceptive self-efficacy, such that high r,
high K women will have the highest contraceptive self-efficacy
Method
Participants
Two hundred and eighty-three women participated in the
study. Participants were either recruited using the SONA system within the
Western Illinois University (WIU) Psychology Department or through convenience
sampling, using the software survey data collection tool SurveyMonkey
(SurveyMonkey, Inc.).
The mean age of total participants was 23.75 (SD = 7.35), and 82.7% of the sample was
Caucasian, 8.8% African American/African, 1.8% Asian American/Asian, 2.8%
Hispanic, and 2.8% Multiple Ethnicity/Mixed. Of the participants, 42.8% were
single and dating exclusively, 17.3% were single and not dating, 13.4% were
married, 12.0% were single and dating casually, 8.1% were engaged to be
married, and 5.3% were single and cohabiting. The majority of participants identified
as heterosexual (90.1%), 6.4% identified as bisexual, and 1.4% identified as
homosexual. Of the participants, 26.9% identified as Catholic, 26.9% identified
as Christian, 19.1% identified as having no religious affiliation, 9.2%
identified as Atheist, and 3.5% identified as Agnostic. The majority of participants
were insured by their parents (54.1%), 15.2% of the participants were insured
by their employers, 9.5% of the participants were insured by their university,
5.3% of the participants were insured by the government, and 5.3% of the participants
were uninsured. Lastly, 84.1% of participants identified their most recent sex
partner as being male and 2.5% identified their most recent sex partner as
female. For the highest education level of participants, 17% were Freshman,
22.1% were Sophomore, 18% were Junior, 7% were Senior, 12% were Graduate
Student, 14% graduated college, 6% held a professional degree, 4% completed
graduate school, 5% received a high school education or less.
Contraceptive method.
Two hundred and
seventy-six participants reported a primary method, or their primary method was
determined by their responses on Current Contraceptive Method and Recent
Contraceptive Method questions of the CMQ. The majority of participants
reported the pill as their primary contraceptive method (35. 8%), 23% reported
using no method, 21.2% reported using the condom as their primary method, 6.9%
reported using the IUD as their primary method, and 3.3% reported using the
vaginal ring as their primary method.
Participants could denote any
methods they use, including more than one method. For both Current and Recent
Methods reported on the CMQ, 11.4% of participants indicated they used no
method, 27.3% of participants indicated they used the pill, 28.9% indicated
they used the condom, 14.0% indicated they used withdrawal, .05% indicated they
used fertility awareness, .04% indicated they used the IUD, .03% indicated they
used the ring, .02% indicated they used the shot, .01% indicated they used the
patch, .01% indicated they use the implant, .008% indicated they use male
partner sterilization, .006% indicated they use the female condom, .004%
indicated they used spermicide, and .002% indicated they used female
sterilization.
Participants could also denote if
they were dual method users (e.g., pill and condom, vaginal ring and condom,
etc.); participants must have reported using the condom in addition to another
method. Dual method use was inferred from their responses on the Current or
Recent Methods portion of the Contraceptive Methods Questionnaire as well as
their responses on the two dual method intention items on the General Errors in
Contraceptive Use Scale. The majority of participants were single method users
(N = 208), while 68 participants reported being dual method users.
Interestingly, many participants reported using the withdrawal method in
addition to other methods listed in the Current or Recent Methods on the CMQ. While
majority of participants did not denote using the withdrawal method in addition
to another method, 68 participants reported using withdrawal in conjunction
with other methods.
Analysis participants.
Participants
recruited outside of the WIU Department of Psychology’s Human Subject Pool only
made up 12.6% of participants used in analysis. The mean age for participants
in analysis was 21.56 (SD = 5.13). Of
analysis participants, 70.5% were Caucasian, 22.1% were African
American/African, 3.2% were Hispanic, and 4.2% were Multiple Ethnicity/Mixed.
Of analysis participants, 28.4% were college freshman, 20.0% were college
sophomores, 17.9% were college juniors, 17.9% were college seniors, 6.3% were
graduate students, 3.2% completed graduate school, 1.1% graduated from college,
and 2.1% held a professional degree. Of analysis participants, 21.1% were not
dating, 11.6% were dating casually, 50.5% were dating exclusively, 8.4% were
engaged, and 8.4% were married. Of analysis participants, 94.7% were
heterosexual, 1.1% were homosexual, and 4.2% were bisexual. Of analysis
participants, 13.7% reported no religious affiliation, 2.1% identified as
Atheist, 1.1% identified as Agnostic, 27.4% identified as Catholic, and 37.9%
identified as Christian. The Institutional Review Board of WIU reviewed and
approved this study before administration.
Procedure
Participants read an Informed Consent before any data was
collected; further participation signified informed consent. Time of completion
ranged between 45 minutes to one hour. The measures administered through the
SONA system and through SurveyMonkey were identical, with the exception that
SurveyMonkey allowed a skip question formation for ease of survey completion. In
addition, titles of measures were not included as to avoid any priming effects
of the scale title. Participants were given a debriefing form that reminded
them of the continued privacy of their responses and described the purpose of
the study. Eligible WIU participants were awarded PURE credit, a requirement
for the completion of General Education Psychology courses, upon completion of
the study.
Measures
Demographics. A demographic questionnaire was created to gather demographic
information from the participant. Items include age, year in school, ethnicity,
religion, religiosity, current relationship status, present sexual orientation,
current living arrangements, health insurance provider, current health, sexual
status, intercourse frequency in the past year, age at first intercourse,
number of children, frequency of miscarriages, frequency of abortions, gender
of the most recent sexual partner, sterilization, and infertility (see Appendix
A).
Contraceptive
Methods Questionnaire. The
Contraceptive Methods Questionnaire consists of a checklist for known methods
of contraception (see Appendix B). The questionnaire addresses contraceptive
methods (i.e., birth control pills, condoms, vaginal ring, etc.) participants
are currently using and used during their most recent intercourse. The
questionnaire includes a list of possible known methods of contraception as
well as the informal terms, often a brand name (e.g., The Pill, Depo-Provera,
NuvaRing, etc.).
Contraceptive Use
Questionnaire.
The Contraceptive Use Questionnaire (CUQ) consists of six subscales: General
Knowledge of Contraception Scale; General Errors in Contraceptive Use Scale;
Intention, Consistency, and Perfection of Contraceptive Use Scale; and Method
Specific Errors in Contraceptive Use Scale. The CUQ was created through
modification of the Contraceptive Utilities, Intentions, and Knowledge Scale (CUIKS; Condelli, 1984). The CUIKS addresses the contraceptive
behaviors of the participants, including how “well” they use their method. The
scale was modified for the current study’s specific needs.
General Knowledge of Contraception Scale. The General Knowledge of
Contraception portion was modified from the CUIKS for brevity and to include
more relevant forms of contraception used today (see Appendix C). Cronbach’s
alpha revealed satisfactory reliability (α = .86). The section consists of
21 multiple-choice questions assessing general knowledge regarding
contraception. A sample knowledge item is: “The pill: (a) prevents ovulation,
(b) keeps cervical mucous very thin, (c) changes the lining of the uterus to
make implantation unlikely, (d) both A & C, (e) all of the above;” the
correct answer being A. The General Knowledge of
Contraception Scale has a total score of 21 points, with each correct answer
earning the participant one point and each incorrect/no response earning the
participant zero points. Higher scores on the General Knowledge Scale indicate
greater knowledge of contraception. Two hundred and forty seven participants
completed the General Knowledge of Contraception Scale; the mean score was
12.40 (SD = 2.66).
General Errors in Contraceptive Use Scale. Participants
completed the General Errors in Contraceptive Use Scale that assessed their
contraceptive use behaviors (see
Appendix D). A sample item is: “I have engaged
in unprotected sex because the event was unplanned or undesired;” participants
responded to seven items on a five-point Likert scale from 1 (definitely not true of me) to 5 (definitely true of me). Total scores were
calculated by reversing four items then summing over items; higher scores
indicate greater general contraceptive use skill. Cronbach’s alpha was low for
this scale (α =
.68), which could be attributed to two of the items specifically assessing
dual use behaviors, while four specifically assessed their engagement in
unprotected intercourse. Two hundred
and thirty-seven participants completed the General Skills in Contraceptive Use
Scale; the mean score was 23.06 (SD =
5.13).
Intention, Consistency, and Perfection of Contraceptive Use Scale.
The
Intention, Consistency, and Perfection of Contraceptive Use Scale (ICPCUS)
consists of items specific to different forms of contraception that measure
intention to use, consistency in use, and perfection in use for the pill, the
condom, the IUD, the vaginal ring, or other methods (see Appendix E). For each
method, two items measured intention, two items measured consistency, and two
items measured perfection. For example,
for the Pill, an intention item is: “I will use the pill during my next sexual
intercourse.” A consistency item is: “I
would describe my pill contraceptive behavior in the past 3 months as
consistent (administering the pill daily at the same time, etc.).” A perfection item is: “I would describe my
pill contraceptive behavior in the past 3 months as perfect (administering the
pill daily at the same time, etc.).” Responses were made on a five-point scale
from 1 (definitely not true of me) to
5 (definitely true of me);
participants were marked N/A (not
applicable) for methods they were not employing. For participants’ primary
method, the scores were summed for each area and higher scores indicate greater
intention, consistency of use, and perfection of use by the participant,
comprising their Primary Method General Use Skills score. Two hundred and
seventy-five participants completed the Intention, Consistency, and Perfection
of Contraceptive Use Scale; the mean score was 17.88 (SD = 11.95).
Method Specific Errors in Contraceptive Use Scale. Participants completed a Method
Specific Errors in Contraceptive Use Scale that assessed method specific
contraceptive use behaviors (see Appendix F). Eleven items measured
method-specific errors; participants answered questions specific to the pill (2
items), the condom (6 items), the IUD (1 item), the vaginal ring (2 items), and
answered not applicable (N/A) for
methods they were not using. A sample item is: “During the past year, I took my
pill at the same time every day;” participants responded to the 11 items using
a five-point Likert scale from 1 (definitely
not true of me) to 5 (definitely true
of me), and participants not using that specific method reported not
applicable. For the participants’ primary method, after reverse scoring, scores
were averaged; higher scores indicate greater method specific use skill,
comprising their Primary Method Specific Use Skill score. Two hundred and
seventy-four participants completed the Method Specific Errors in Contraceptive
Use Scale; the mean was 4.93 (SD =
6.60).
Sociosexual
Orientation Scale.
The Sociosexual Orientation Scale (SOI; Simpson & Gangestad, 1991) measured
differences in willingness for or endorsement of casual, promiscuous sex (see Appendix
G). The seven-item scale has two past behavioral items and one future
behavioral item; one item assesses fantasies with participants responding on an
eight-point Likert from 1 (never) to
8 (at
least once a day). Three items assess attitudes, with participants
responding on a nine-point Likert scale from 1 (strongly disagree) to 9 (strongly
agree). The weighted total was computed using scoring from Simpson and
Gangestad (1991); of the 139 participants that completed the SOI, the mean was
43.97 (SD = 30.52). Higher scores represent an unrestricted sociosexual orientation.
Cronbach’s alpha (.77) demonstrated the internal consistency of the scale.
Brief Sexual
Attitudes Scale. The
Brief Sexual Attitudes Scale (BSAS; Hendrick, Hendrick, & Reich, 2006) assessed
sexual attitudes (see Appendix H). The overall Cronbach’s alpha for the BSAS
was .83, (N = 140). The BSAS has four subscales consisting of Permissiveness (10 items; α
= .90) with a mean of 2.16 (SD
= .90), Birth Control (3 items; α
= .86) with a mean of 4.56 (SD =
.73), Communion (5 items; α = .80)
with a mean of 3.87 (SD = .85), and Instrumentality (5 items; α
= .75) with a mean of 3.01 (SD = .84). A sample item from the
Instrumentality subscale is: “The main purpose of sex is to enjoy yourself;” 140
participants responded on a five-point Likert scale from 1 (strongly disagree with the statement) to
5 (strongly agree with the statement).
Sexual Desire
Inventory. The
Sexual Desire Inventory (SDI; Spector, Carey, & Steinberg, 1996) assessed sexual
desire (see Appendix I). The SDI is a 14-item scale that includes two subscales:
Dyadic Sexual Desire (8 items; α = .90), which measures the desire to engage in sexual
behaviors with another individual, and Solitary Sexual Desire (6 items; α = .91),
which measures the desire to engage in sexual behaviors in solitary. A sample
Solitary Sexual Desire item is: “Compared to other people of your age and sex,
how would you rate your desire to behave sexually with a partner?” and 139 participants
responded on a 9-point Likert scale from 0 (much
less desire) to 8 (much more desire).
Higher scores are indicative of higher sexual desire; the mean for SDI Dyadic
Sexual Desire was 4.75 (SD = 1.67)
and the mean for SDI Solitary Sexual Desire was 2.37 (SD = 2.04).
Sexual Sensation
Seeking Scale. The
Sexual Sensation Seeking Scale (Kalichman et al., 1994) assessed the need for
varied, novel, and complex sexual experience and risk-taking behaviors to
enhance the sexual experience (see Appendix J). The ten-item scale has a
Cronbach’s alpha of .83. A sample item is: “I enjoy watching ‘X-rated’ videos;”
138 participants responded on a four point Likert scale from 1 (not at all like me) to 4 (very much like me). Higher scores were
indicative of higher sexual sensation seeking; the mean was 2.13 (SD = .58).
High-K Strategy
Scale. The
High-K Strategy Scale assessed the life history strategy of individuals
(Giosan, 2006; see Appendix K). The 26-item scale tapped into health,
attractiveness, social capital, and upward mobility; the scale is scored in the
slow strategy direction. The scale had a high internal consistency reliability,
α = .96. A
sample item is: “I live in a community to which I am well suited;” participants
responded on a five point Likert scale from 1 (strongly disagree) to 5 (strongly
agree). Of the 222 participants that completed the scale, the mean
score was 5.03 (SD = 1.08).
Mini-K. In the context of life history
theory, Figueredo and associates developed the Mini-K in 2006 (see Appendix L).
The Mini-K is a 20-item scale that measured the extent to which participants
endorse slow life history strategies. The Cronbach’s alpha of the scale was
moderate, α = 83. A sample item is: “I am often in
social contact with my blood relatives.” One hundred and thirty nine participants
responded to the items on a seven point Likert scale from 1 (disagree strongly) to 7 (agree strongly). The mean for the Mini-K
was 5.41 (SD = .67).
Contraceptive
Attitudes Scale. The Contraceptive Attitudes Scale measured
attitudes towards the use of contraceptives in general (Black & Pollack,
1987; see Appendix M). The scale consists of 17 positive items and 15 negative
items; sample items from the scale include: “It is no trouble to use
contraceptives” and “I believe it is wrong to use contraceptives.” Two hundred
and twenty two participants responded on a five-point Likert scale from 1 (strongly disagree)
to 5 (strongly agree). Higher scores indicate more positive
attitudes towards using contraceptives after reverse scoring; the mean was 3.27
(SD = 1.54). The scale’s internal
consistency reliability was high (α = .93).
Contraceptive
Immorality Scale. The
questions pertaining to contraceptive immorality were adapted from A Scale to
Assess University Women’s Attitudes About Contraceptives (Fisher et al., 1998; see Appendix N). Only five
items are utilized from this measure to ensure brevity. A sample item is:
“Using contraception is immoral;” 169 participants responded on a five-point
Likert scale from 1 (strongly disagree) to 5 (strongly
agree). All 5 items were reverse
scored; higher scores indicated higher belief that contraception is moral.
Internal consistency reliability was high α =.88, (M = 4.67, SD = .61).
Contraceptive
Self-Efficacy Scale. The
Contraceptive Self-Efficacy Scale (CSE) assessed motivational barriers to
contraceptive use among sexually active adolescent women (see Appendix O).
Levinson (1986) created the scale to measure the ability of a female adolescent
to control sexual and contraceptive situations. Cronbach’s alpha for this measure
was adequate, (α
=.64). A sample item is: “When I have sex, I can enjoy it as
something that I really wanted to do;” 214 participants responded on a
five-point Likert scale from 1 (not at
all true of me) to 5 (completely true of me). The mean for the
CSE was 3.96 (SD = .55).
Hurlbert Index of
Sexual Excitability. The Hurlbert Index of Sexual Excitability
(HISE; Apt & Hurlbert, 1993) assessed a female’s ability to become sexually
excited (see Appendix P). The scale consists of 25 items and participants responded
on a five-point Likert scale from 0 (never)
to 4 (all of the time). A sample item
is: “I find sex with my partner to be exciting.” Higher scores indicate higher
sexual excitability (M = 3.90, SD = .63). Two hundred and ten participants
completed the HISE and Cronbach’s alpha for this measure was high, (α =.90).
Consideration of
Future Consequences Scale. The
Consideration of Future Consequences Scale (Strathman, Gleicher, Boninger, &
Edwards, 1994) assessed an individual’s consideration of distant outcomes of
current behaviors and the extent of the influence of these outcomes (see
Appendix Q). Only the Future Orientation subscale was used for the purpose of
this study. The Future Orientation subscale has a mediocre Cronbach’s alpha of
.64. The subscale has five items; a sample item from the Future Orientation subscale
is: “I consider how things might be in the future and
try to influence those things with my day-to-day behavior.” One hundred and
thirty-nine participants responded on a five-point Likert scale from 1 (extremely uncharacteristic) to 5 (extremely characteristic). Higher scores
on the subscale indicate greater consideration of future consequences (M = 3.79, SD = .57).
Data Screening
The data were checked for univariate
outliers by examining box plots. Two participants were noted as being outliers
on three or more scales and removed from analysis; likewise, individuals that
self-reported as being abstinent were removed from analysis (N = 10). The minimum amount of data
needed for subsequent factor analyses were marginally satisfied, with a final
sample size of 96 (using listwise deletion). The skewness and kurtosis for each
scale were within the tolerable range for assuming a normal distribution and
examination of the histograms and stem-and-leaf plots revealed the
distributions to look normal.
Life History Strategies Factor Analysis
First, the Brief Sexual
Attitudes Scale was divided into the four subscales (Permissiveness, Communion,
Birth Control, and Instrumentality), the Sexual Desire Inventory was divided
into the two subscales (Solitary and Dyadic), and only the Future Orientation
subscale was used from the Consideration of Future Consequences. The HKSS,
Mini-K, Sexual Sensation Seeking Scale, Hurlbert Scale of Sexual Excitability,
and Sociosexuality Inventory, and the aforementioned subscales were utilized in
the factor analysis. See Table 2 for summary of scales used in the Life History
strategies factor analysis. Second, the factorability of the 12 scales was
examined. The factorability of the 12 scales was assessed using the
Kaiser-Meyer-Olkin measure of sampling adequacy, which was above the
recommended value of .6 (.62), and Bartlett’s test of sphericity was
significant, χ2
(66) = 231.98, p < .01. The
diagonals of the anti-image correlation matrix were all over .5 (with the
exception of Brief Sexual Attitudes Birth Control, at .42), supporting the
inclusion of each item in the following factor analysis. Brief Sexual Attitudes
Birth Control and Brief Sexual Attitudes Instrumentality had initial
communalities below .2 (see Table 3). Sexual Desire Inventory Dyadic, Brief
Sexual Attitudes Communion, and Future Orientation had initial communalities
below .3 (see Table 3). HKSS, Mini K, Brief Sexual Attitudes Permissiveness,
Sexual Desire Inventory Soloitary, Sexual Sensation Seeking, Hurlbert Scale of
Sexual Excitability, and Sociosexuality had initial communalities above .3 (see
Table 3).
Table 2
Descriptive Statistics Summary
for Life History Strategies Scales
Scale
|
N
|
# of
Items
|
Mean
|
SD
|
α
|
Sociosexuality Inventory
|
139
|
7
|
43.97
|
30.52
|
.77
|
Brief Sexual Attitudes Permissiveness
|
140
|
10
|
2.16
|
.90
|
.90
|
Brief Sexual Attitudes Birth Control
|
140
|
3
|
4.56
|
.73
|
.86
|
Brief Sexual Attitudes Communion
|
140
|
5
|
3.87
|
.85
|
.80
|
Brief Sexual Attitudes Instrumentality
|
140
|
5
|
3.01
|
.84
|
.75
|
Dyadic Sexual Desire
|
139
|
8
|
4.75
|
1.67
|
.90
|
Solitary Sexual Desire
|
139
|
6
|
2.37
|
2.04
|
.91
|
Sexual Sensation Seeking Scale
|
138
|
10
|
2.13
|
.58
|
.83
|
Hurlbert Inventory of Sexual Excitability
|
139
|
25
|
3.90
|
.63
|
.90
|
High K Strategy Scale
|
222
|
23
|
5.03
|
1.08
|
.96
|
Mini K
|
139
|
20
|
5.41
|
.67
|
.83
|
Future Orientation Subscale
|
139
|
5
|
3.79
|
.57
|
.64
|
Table 3
Life History Strategies Factor
Analysis Initial Communalities
Initial Communalities
|
|
High K Strategy
|
.40
|
Mini K
|
.31
|
Future Orientation Factor of CFC
|
.24
|
Brief Sexual Attitudes Permissiveness
|
.50
|
Brief Sexual Attitudes Birth Control
|
.15
|
Brief Sexual Attitudes Communion
|
.27
|
Brief Sexual Attitudes Instrumentality
|
.15
|
Sociosexuality
|
.51
|
Sexual Sensation Seeking
|
.34
|
Hurlbert Scale of Sexual Excitability
|
.33
|
Sexual Desire Inventory Solitary
|
.30
|
Sexual Desire Inventory Dyadic
|
.29
|
A Principal Axis
Factoring method of extraction with an Oblimin rotation was utilized. The
initial eigenvalues, 2.70 and 1.98 respectively, showed a clear two-factor
solution, with the first factor explaining 22.58% of the variance and the
second factor explaining 16.52% of the variance. Two other factors explained
11.92 and 9.35 percent of the variance, with 1.43 and 1.12 eigenvalues
respectively. Due to apparent “leveling off” as examined in the scree plot and
theoretical considerations, only the first two factors were analyzed further.
Both factors explained a total of 39.35% of the variance. There was little
difference between an Oblimin and Varimax rotation; the two factors correlated
at -.11.
The results of
the factor analysis confirmed the two-factor hypothesis; the factor-loading
matrix is presented in Table 4. The scales assessing sexual behaviors loaded
strongly on the first factor (e.g., .69 and .57) and subsequently loaded weakly
(e.g., .27) or negatively (e.g., -.03) on the second factor, with scales
assessing non-sexual behaviors; illustrating the distinct nature of these two
factors. Likewise, the scales assessing non-sexual behaviors loaded strongly on
the second factor (e.g., .57) and loaded negatively (e.g., -.15) on the first
factor; this reiterates the distinct and separate nature of these two factors. Contrary
to hypotheses, the Hurlbert Scale of Sexual Excitability loaded moderately on
the second factor, .46, and weakly on the first factor, .23, where it was
hypothesized to load strongest. Also, Brief Sexual Attitudes Instrumentality
loaded moderately on the first factor as predicted, .22, but also loaded
moderately and negatively on the second factor, -.33, not as predicted. Brief
Sexual Attitudes Birth Control loaded weakly on both factors, .05 for the first
and .28 for the second. Brief Sexual Attitudes Permissiveness cross-loaded, but
in the hypothesized direction: positively on the first factor, .56 and
negatively on the second factor, -.40. Brief Sexual Attitudes Communion loaded
weakly on the first and second factor, .17 and .01 respectively.
Table 4
Life History Strategies Factor
Matrix
Factor 1
|
Factor 2
|
|
High K Strategy
|
-.02
|
.52
|
Mini K
|
-.26
|
.57
|
Future Orientation Factor of CFC
|
-.15
|
.46
|
Brief Sexual Attitudes Permissiveness
|
.60
|
-.40
|
Brief Sexual Attitudes Birth Control
|
.05
|
.28
|
Brief Sexual Attitudes Communion
|
.17
|
.01
|
Brief Sexual Attitudes Instrumentality
|
.22
|
-.33
|
Sociosexuality
|
.51
|
-.38
|
Sexual Sensation Seeking
|
.69
|
.27
|
Hurlbert Scale of Sexual Excitability
|
.23
|
.46
|
Sexual Desire Inventory Solitary
|
.57
|
-.03
|
Sexual Desire Inventory Dyadic
|
.48
|
-.14
|
The factor labels
suited the hypothesized predictions; Factor 1 was labeled the “r Factor” and Factor
2 being labeled the “K factor.” However, when factor scores were computed to
use in subsequent hierarchical regression analyses, the scales that did not
follow in line with the theoretical framework were eliminated. The Hurlbert
Scale of Sexual Excitability, Brief Sexual Attitudes Birth Control, Brief
Sexual Attitudes Communion, and Brief Sexual Attitudes Instrumentality scales
were dropped from the subsequent factor analyses, due to the lack of
theoretical support and the presence of weak or cross loadings.
K and r Factor scores. To compute
factor scores, Principal Axis Factoring method of extraction with a Varimax rotation
with Kaiser Normalization was utilized. HKSS, Mini K, Brief Sexual Attitudes
Permissiveness, Sexual Desire Inventory Solitary, Sexual Desire Inventory
Dyadic, Sexual Sensation Seeking, Sociosexuality, and Future Orientation were
inputted into the analysis.
The factorability of the eight scales was examined using the Kaiser-Meyer-Olkin
measure of sampling adequacy, which was above the recommended value of .6
(.65), and Bartlett’s test of sphericity was significant, χ2 (28)
= 172.80, p < .01. Examination of
the anti-image correlation matrix revealed correlations above .5, with the
exception of the HKSS (.49), supporting their inclusion in the analysis. With
the exception of Future Orientation, HKSS, Sexual Desire Inventory Solitary,
Mini K, and Sexual Sensation Seeking, the initial communalities were above .3. Variance
is accounted for by the two-factor solution was 52.78%. The rotated factor
matrix is presented in Table 5. Factor scores were created for each of the two
factors, based on the mean of the items, which had their primary loadings on
each factor. Higher scores on the r Factor indicated greater endorsement of
sexual behaviors and higher scores on the K Factor indicated greater
endorsement of non-sexual behaviors. Descriptive statistics are
presented in Table 6. The skewness and kurtosis were within the tolerable range
for assuming a normal distribution and examination of the histograms revealed
the distributions to look normal.
Table 5
Life History Strategies Factor
Scores Factor Matrix
r Factor
|
K Factor
|
|
High K Strategy
|
.62
|
|
Mini K
|
.60
|
|
Future Orientation Factor of CFC
|
.52
|
|
Brief Sexual Attitudes Permissiveness
|
.72
|
|
Sociosexuality
|
.66
|
|
Sexual Sensation Seeking
|
.58
|
|
Sexual Desire Inventory Solitary
|
.49
|
|
Sexual Desire Inventory Dyadic
|
.51
|
Note: Factor loadings < .40
are suppressed
Table 6
Descriptive Statistics for r
Factor and K Factor Scores (N = 99)
M
(SD)
|
Skewness
|
Kurtosis
|
|
r
Factor
|
.00053 (.87718)
|
.34
|
.44
|
K
Factor
|
.00146 (.81292)
|
.44
|
-.40
|
Effectiveness Score Factor Analysis
In order to test hypothesis one,
a factor analysis was ran to compute the participants’ contraceptive method
effectiveness score. First, Primary
Method Specific Errors, Primary Method General Errors, General Errors in
Contraceptive Use, and General Knowledge of Contraception was factor analyzed
and one factor was extracted using Principal Components Analysis. Examination
of initial communalities and the anti-image correlation matrix revealed General
Knowledge of Contraception did not correlate with the other three scales, and
was consequently dropped from analysis. The factorability of the three scales
was examined using the Kaiser-Meyer-Olkin measure of sampling adequacy, which
was satisfactory (.53). Also, Bartlett’s test of sphericity was significant, χ2 (3)
= 16.83, p < .01. A Principal
Components Analysis was utilized to extract one factor from the three scales,
and 44.72% of the variance was explained by this single factor. The component matrix
is presented in Table 7. Component scores were
created from the single factor solution; higher scores indicated higher general
and method specific use skills. In the next step, participant’s scores
on the General Knowledge of Contraception Scale were converted into z scores and subsequently averaged with
the contraceptive use skills factor scores. This represented a composite
effectiveness score of their contraceptive use skill and contraceptive
knowledge. Lastly, participants’ specific method was taken into account by
multiplying their composite score of use skills and knowledge by a percentage.
This percentage was derived from known contraceptive efficacy (see Trussell,
2007): with typical use, eight women (of 100) experience an unintended
pregnancy within the first year of use of the pill or ring, therefore
participants using either the pill or ring received 92% of their composite
effectiveness score. To calculate what percentage of their score they received,
pill and vaginal ring users’ composite scores were multiplied by .92, condom
users’ composite scores were multiplied by .85, and IUD users’ composite scores
were multiplied by .992. The resulting score was known as their overall
contraceptive effectiveness score. Descriptive statistics are presented in Table
8 and 9, separated by single method users and dual method users.
Table 7
Contraceptive Use Skill Factor
Analysis Factor Loadings for Effectiveness Score
Factor Loadings
|
|
General Contraception Use Skill
|
.72
|
Primary Method General Use Skill
|
.78
|
Primary Method Specific Use Skill
|
.47
|
Table 8
Descriptive
Statistics for Contraceptive Effectiveness Score, Single Users
M(SD)
|
Skewness
|
Kurtosis
|
|
Effectiveness
Score (skill)
|
-.24(.96)
|
-.67
|
.02
|
Effectiveness
Score (skill &
knowledge)
|
-.09(.80)
|
-.12
|
-.59
|
Effectiveness
Score (skill,
knowledge, & method)
|
-.09(.66)
|
-.28
|
-.42
|
Table 9
Descriptive
Statistics for Contraceptive Effectiveness Score, Dual Users
M(SD)
|
Skewness
|
Kurtosis
|
|
Effectiveness
Score (skill)
|
.49(.91)
|
-.85
|
.74
|
Effectiveness
Score (skill &
knowledge)
|
.22(.72)
|
-.60
|
1.48
|
Effectiveness
Score (skill,
knowledge, & method)
|
.26(.58)
|
.09
|
-.58
|
Results
Contraceptive Effectiveness
It was
hypothesized that an interaction between r and K strategies would be found to
predict contraceptive method
effectiveness, such that high r and high K women would utilize the most
effective methods. Results did not support my first hypothesis, N = 71. To examine the contribution of the
r Factor, the K Factor, and their interaction to explain contraceptive
effectiveness (skill only), a hierarchical multiple regression analysis was
performed. The r Factor was entered in the first step, the K Factor was entered
in the second step, and step three included the Interaction variable (r Factor
X K Factor). Before analysis was performed, the independent variables were
examined for collinearity. Results of the variance inflation factor (VIF) were
all less than 2.0, and collinearity tolerance were greater than .80, suggesting
the estimated βs were well established in the model. The
results were not significant, p >
.05.
Results from analysis on contraceptive effectiveness (skill
and knowledge) did not support my first hypothesis, N = 99. To examine the contribution of the r Factor, the K Factor,
and their interaction to explain contraceptive effectiveness (skill and
knowledge), a hierarchical multiple regression analysis was performed. The r
Factor was entered in the first step, the K Factor was entered in the second
step, and step three included the Interaction variable (r Factor X K Factor). Before
analysis was performed, the independent variables were examined for collinearity.
Results of the variance inflation factor (VIF) were all less than 2.0, and
collinearity tolerance were greater than .92, suggesting the estimated βs were well established in the model. The results were not
significant, p > .05.
Results from analysis on contraceptive effectiveness (skill,
knowledge, and method) did not support my first hypothesis, N = 76. To examine the contribution of
the r Factor, the K Factor, and their interaction to explain contraceptive
effectiveness (skill, knowledge, and method), a hierarchical multiple
regression analysis was performed. The r Factor was entered in the first step,
the K Factor was entered in the second step, and step three included the
Interaction variable (r Factor X K Factor). Before analysis was performed, the
independent variables were examined for collinearity. Results of the variance
inflation factor (VIF) were all less than 2.0, and collinearity tolerance were
greater than .80, suggesting the estimated βs were
well established in the model. The results of step three were not significant, p > .05. The unstandardized regression
coefficients (b) and the intercept, and the standardized regression
coefficients (β) are reported in Table 10. A graph illustrating the
interaction of the two factors is presented in Figure 23.
Table 10
Summary of
Hierarchical Regression Analysis for Contraceptive Effectiveness, N = 76
Step
|
Variable
|
ΔR2
|
β
|
b
|
1
|
r
Factor
|
.00
|
.10
|
.10
|
2
|
K
Factor
|
.01
|
.10
|
.09
|
3
|
Interaction
|
.01
|
.10
|
.13
|
Intercept
|
-.09
|
Note: Standardized (β)
and unstandardized (b) coefficients are from the final model (i.e., after Step
3). ΔR2 values are provided for each
predictor as they were entered in consecutive steps. The overall model was not significant,
R2 = .02, F(3,72) = .49, p > .05.

Contraceptive Knowledge
It was
hypothesized that an interaction between r and K strategies would be found to
predict contraceptive
knowledge, such that high r and high K women would be most knowledgeable about
contraception. Results did not support my second hypothesis, N = 100. To examine the contribution of
the r Factor, the K Factor, and their interaction to explain contraceptive knowledge,
a hierarchical multiple regression analysis was performed. The r Factor was
entered in the first step, the K Factor was entered in the second step, and
step three included the Interaction variable (r Factor X K Factor). The results were not
significant, p > .05. The unstandardized regression
coefficients (b) and the intercept, and the standardized regression
coefficients (β) are reported in Table 11. A graph illustrating the
interaction of the two factors is presented in Figure 24.
Table 11
Summary of
Hierarchical Regression Analysis for Contraceptive Knowledge, N = 99
Step
|
Variable
|
ΔR2
|
β
|
b
|
1
|
r
Factor
|
.02
|
.12
|
.41
|
2
|
K
Factor
|
.00
|
-.04
|
-.12
|
3
|
Interaction
|
.01
|
.08
|
.34
|
Intercept
|
11.62
|
Note: Standardized (β)
and unstandardized (b) coefficients are from the final model (i.e., after Step
3). ΔR2 values are provided for each
predictor as they were entered in consecutive steps. The overall model was not
significant, R2 = .03, F(3,95) = .93, p > .05.

General Contraceptive Attitudes
It was
hypothesized that an interaction between r and K strategies would be found to
predict general
attitudes towards contraceptives, such that high r, high K women would have the
most positive attitudes. Results
did not exactly support my third hypothesis, N = 100. To examine the contribution of the r Factor, the K Factor,
and their interaction to explain general attitudes towards contraception, a
hierarchical multiple regression analysis was performed. The r Factor was
entered in the first step, the K Factor was entered in the second step, and
step three included the Interaction variable (r Factor X K Factor). The results of step three indicated that the variance
accounted for (R2) by the three
variables equaled .05 (adjusted R2
= .02), which was not significantly
different from zero, F (3,
96) = 1.72, p >.05. The unstandardized regression
coefficients (b) and the intercept, and the standardized regression
coefficients (β) are reported in Table 12. A graph illustrating the
interaction of the two factors is presented in Figure 25.
Table 12
Summary of
Hierarchical Regression Analysis for Contraceptive Attitudes, N = 100
Step
|
Variable
|
ΔR2
|
β
|
b
|
1
|
r Factor
|
.01
|
.02
|
.02
|
2
|
K
Factor
|
.04*
|
-.20
|
-.20✚
|
3
|
Interaction
|
.00
|
.07
|
.08
|
Intercept
|
4.09
|
Note: Standardized (β)
and unstandardized (b) coefficients are from the final model (i.e., after Step
3). ΔR2 values are provided for each
predictor as they were entered in consecutive steps. The FΔ for Model 2 was significant, R2
= .05, FΔ (1,97) = 4.02, p < .05. *
p < .05;
✚ p = .06

Contraceptive Morality Attitudes
It was hypothesized
that an interaction between r and K strategies would be found to predict morality attitudes
towards contraceptives, such that high r, high K women would be the most
morally accepting of contraceptives. Results did not fully support my fourth hypothesis, N = 100. To examine the contribution of
the r Factor, the K Factor, and their interaction to explain morality attitudes
towards contraception, a hierarchical multiple regression analysis was
performed. The r Factor was entered in the first step, the K Factor was entered
in the second step, and step three included the Interaction variable (r Factor
X K Factor). The results of step three indicated that
the variance accounted for (R2)
with the three variables equaled .07 (adjusted R2 = .04), which was
nearly significantly different from zero, F
(1, 98) = 2.32, p = .080. The unstandardized regression
coefficients (b) and the intercept, and the standardized regression
coefficients (β) are reported in Table 13. A graph illustrating the
interaction of the two factors is presented in Figure 26.
Table 13
Summary of Hierarchical Regression Analysis
for Contraceptive Morality Attitudes, N = 100
Step
|
Variable
|
ΔR2
|
β
|
b
|
1
|
r
Factor
|
.04✚
|
.21
|
.17*
|
2
|
K
Factor
|
.02
|
.14
|
.12
|
3
|
Interaction
|
.02
|
.13
|
.14
|
Intercept
|
4.57
|
Note: Standardized (β) and unstandardized
(b) coefficients are from the final model (i.e., after Step 3). ΔR2 values are
provided for each predictor as they were entered in consecutive steps.The
overall model was not significant, R2 = .07, F(3, 96) = 2.32, p = .08.
* p
< .05; ✚ p =
.06

Contraceptive Self-Efficacy
It was
hypothesized that an interaction between r and K strategies would be found to
predict
contraceptive self-efficacy, such that high r, high K women would have the
highest contraceptive self-efficacy. Results from single method users did not fully support my
fifth hypothesis, (N = 71). To
examine the contribution of the r Factor, the K Factor, and their interaction
to explain contraceptive self-efficacy, a hierarchical multiple regression
analysis was performed. For single method users (N = 71), the r Factor was entered in the first step, the K Factor
was entered in the second step, and step three included the Interaction
variable (r Factor X K Factor). The results of step three
indicated that the variance accounted for (R2)
with variables entered equaled .08 (adjusted R2 = .04), which was
not significantly different from zero, F (3, 67) = 1.96, p >.05. The unstandardized regression
coefficients (b) and the intercept, and the standardized regression
coefficients (β) are reported in Table 14. A graph illustrating the
interaction of the two factors is presented in Figure 27.
Table 14
Summary of
Hierarchical Regression Analysis for Contraceptive Self-Efficacy from Single
Method Users, N = 71
Step
|
Variable
|
ΔR2
|
β
|
b
|
1
|
r
Factor
|
.00
|
.04
|
.03
|
2
|
K
Factor
|
.05
|
.26
|
.17*
|
3
|
Interaction
|
.03
|
.19
|
.16
|
Intercept
|
3.91
|
Note: Standardized (β)
and unstandardized (b) coefficients are from the final model (i.e., after Step
3). ΔR2 values are provided for each
predictor as they were entered in consecutive steps. The overall model was not
significant, R2 = .08, F(3, 67) = 1.97, p = .06. *
p < .05; ✚ p = .06

Additional Analyses
Age. To examine the contribution of the
r Factor, the K Factor, and their interaction to explain age, a hierarchical
multiple regression analysis was performed. For all participants (N = 100), the r Factor was entered in
the first step, the K Factor was entered in the second step, and step three
included the Interaction variable (r Factor X K Factor). The results of step three indicated that the variance
accounted for (R2) with
the three variables entered equaled .33 (adjusted R2 = .31), which was
significantly different from zero, F
(3, 96) = 15.77, p < .01. Thirty-three percent of the variance in
age can be accounted for by the two factors and their interaction. The
unstandardized regression coefficients (b) and the intercept, and the
standardized regression coefficients (β) are reported in Table 15. A
graph illustrating the interaction can be found in Figure 28.
Table 15
Summary of
Hierarchical Regression Analysis for Age, N = 100
Step
|
Variable
|
ΔR2
|
β
|
b
|
1
|
r Factor
|
.08**
|
.38
|
2.22***
|
2
|
K
Factor
|
.19***
|
.48
|
3.02***
|
3
|
Interaction
|
.06***
|
.25
|
1.92**
|
Intercept
|
21.93
|
Note: Standardized (β)
and unstandardized (b) coefficients are from the final model (i.e., after Step
3). ΔR2 values are provided for each predictor
as they were entered in consecutive steps.The overall model was significant, R2
= .33, F(3, 96) = 15.77, p < .001. ** p < .01; ***p <.001

Delay of sexual intercourse.
To examine
the contribution of the r Factor, the K Factor, and their interaction to
explain the time lapsed from age at first sexual intercourse and age at first
menstruation, a hierarchical multiple regression analysis was performed. Delay
of Sex was computed by subtracting Age at First Menstruation from Age at First
Sexual Intercourse, M = 4.22, SD = 2.49. For sexually active participants
(N = 92), the r Factor was entered in
the first step, the K Factor was entered in the second step, and step three
included the Interaction variable (r Factor X K Factor). The results of step three indicated that the variance
accounted for (R2) with
the variables entered equaled .05 (adjusted R2
= .02), which was not significantly
different from zero, F (3,
88) = 1.67, p > .05. The unstandardized regression
coefficients (b) and the intercept, and the standardized regression
coefficients (β) are reported in Table 16. A graph illustrating the
interaction of the two factors is presented in Figure 29.
Table 16
Summary of
Hierarchical Regression Analysis for Delay of Sex, Not Sexually Active
Participants Removed, N = 92
Step
|
Variable
|
ΔR2
|
β
|
b
|
1
|
r
Factor
|
.01
|
-.05
|
-.16
|
2
|
K
Factor
|
.04✚
|
.20
|
.60✚
|
3
|
Interaction
|
.00
|
-.07
|
-.27
|
Intercept
|
4.18
|
Note: Standardized (β)
and unstandardized (b) coefficients are from the final model (i.e., after Step
3). ΔR2 values are provided for each
predictor as they were entered in consecutive steps. The overall model was not significant,
R2 = .05, F(3, 88) = 1.67, p < .05. ✚
p = .07

Religiosity. To examine the contribution of the
r Factor, the K Factor, and their interaction to explain religiosity, a
hierarchical multiple regression analysis was performed. For all participants (N = 100), the r Factor was entered in
the first step, the K Factor was entered in the second step, and step three
included the Interaction variable (r Factor X K Factor). The results of step three indicated that the variance
accounted for (R2) with
the three variables entered equaled .24 (adjusted R2 = .22), which
was significantly different from zero, F
(3,96) = 10.41, p < .01. The unstandardized regression
coefficients (b) and the intercept, and the standardized regression
coefficients (β) are reported in Table 17. A graph illustrating the
interaction of the two factors is presented in Figure 30.
Table 17
Summary of Hierarchical Regression Analysis
for Religiosity, N = 100
Step
|
Variable
|
ΔR2
|
β
|
b
|
1
|
r
Factor
|
.10**
|
-.21
|
-.36*
|
2
|
K
Factor
|
.12***
|
.35
|
.65***
|
3
|
Interaction
|
.02✚
|
-.15
|
-.33✚
|
Intercept
|
2.18
|
Note: Standardized (β)
and unstandardized (b) coefficients are from the final model (i.e., after Step
3). ΔR2 values are provided for each
predictor as they were entered in consecutive steps. The overall model was significant,
R2 = .24, F(3, 96) = 10.41, p < .001. ** p < .01; * p
< .05; ✚
p = .10

Possibility of being
infertile. To
examine the contribution of the r Factor, the K Factor, and their interaction
to explain the possibility of being infertile, a hierarchical multiple
regression analysis was performed. For all participants (N = 100), the r Factor was entered in the first step, the K Factor
was entered in the second step, and step three included the Interaction
variable (r Factor X K Factor). The results of step three
indicated that the variance accounted for (R2)
with the variables entered equaled .06 (adjusted R2 = .04), which was
nearly significantly different from zero, F
(3, 96) = 2.22, p = .09. The unstandardized regression
coefficients (b) and the intercept, and the standardized regression
coefficients (β) are reported in Table 18. A graph illustrating the
interaction of the two factors is presented in Figure 31.
Table 18
Summary of Hierarchical Regression Analysis
for Possibility of Being Infertile, N = 100
Step
|
Variable
|
ΔR2
|
β
|
b
|
1
|
r
Factor
|
.03✚
|
.10
|
.13
|
2
|
K
Factor
|
.04*
|
-.20
|
-.28*
|
3
|
Interaction
|
.00
|
.01
|
.01
|
Intercept
|
2.08
|
Note: Standardized (β)
and unstandardized (b) coefficients are from the final model (i.e., after Step
3). ΔR2 values are provided for each
predictor as they were entered in consecutive steps. The second overall model
was significant, R2 = .07, F(2,97) = 3.36, p < .05.
* p < .05; ✚ p = .10

Sex frequency in the
past year. To
examine the contribution of the r Factor, the K Factor, and their interaction
to explain frequency of sex in the past year, a hierarchical multiple
regression analysis was performed. For sexually active participants (N = 86), the r Factor was entered in the
first step, the K Factor was entered in the second step, and step three
included the Interaction variable (r Factor X K Factor). The results of step three indicated that the variance
accounted for (R2) with
the variables entered equaled .10 (adjusted R2
= .06), which was significantly
different from zero, F (3,
82) = 2.96, p = .04. The unstandardized regression
coefficients (b) and the intercept, and the standardized regression
coefficients (β) are reported in Table 19. A graph illustrating the
interaction of the two factors is presented in Figure 32.
Table 19
Summary of
Hierarchical Regression Analysis for Sex Frequency in the Past Year, Not Active
Participants Removed, N = 86
Step
|
Variable
|
ΔR2
|
β
|
b
|
1
|
r
Factor
|
.07**
|
.29
|
18.96**
|
2
|
K
Factor
|
.01
|
.07
|
4.99
|
3
|
Interaction
|
.02✚
|
.14
|
12.585✚
|
Intercept
|
53.49
|
Note: Standardized (β)
and unstandardized (b) coefficients are from the final model (i.e., after Step
3). ΔR2 values are provided for each
predictor as they were entered in consecutive steps. The overall model was significant,
R2 = .10, F(3,82) = 2.96, p < .05. ** p < .01; ; ✚
p = .18

For sexually active dual method users (N = 25), the r Factor was entered in the first step, the K Factor
was entered in the second step, and step three included the Interaction
variable (r Factor X K Factor). The results of step three
indicated that the variance accounted for (R2)
with the r Factor, the K Factor, and their interaction entered equaled .40
(adjusted R2 = .32), which was significantly different from
zero, F (3, 21) = 4.68, p < .01. The unstandardized regression
coefficients (b) and the intercept, and the standardized regression
coefficients (β) are reported in Table 20. A graph illustrating the
interaction of the two Factors is presented in Figure 33.
Table 20
Summary of
Hierarchical Regression Analysis for Sex Frequency in the Past Year from Dual
Method Users, N = 28
Step
|
Variable
|
ΔR2
|
β
|
b
|
1
|
r
Factor
|
.20*
|
.63
|
20.77***
|
2
|
K
Factor
|
.15*
|
.38
|
14.98*
|
3
|
Interaction
|
.10✚
|
.29
|
11.45✚
|
Intercept
|
37.59
|
Note: Standardized (β)
and unstandardized (b) coefficients are from the final model (i.e., after Step
3). ΔR2 values are provided for each
predictor as they were entered in consecutive steps. The overall model was significant,
R2 = .12, F(3,96) = 4.17, p < .01.
*** p < .001;
*p < .05; ✚ p = .08

Current health. To examine the contribution of the
r Factor, the K Factor, and their interaction to explain reported current
health, a hierarchical multiple regression analysis was performed. For all
participants (N = 100), the r Factor
was entered in the first step, the K Factor was entered in the second step, and
step three included the Interaction variable (r Factor X K Factor). The results of step three indicated that the variance
accounted for (R2) with
the r Factor and K Factor entered equaled .09 (adjusted R2 = .06), which
was significantly different from zero, F
(3, 96) = 3.16, p = .03. The unstandardized regression
coefficients (b) and the intercept, and the standardized regression
coefficients (β) are reported in Table 21. A graph illustrating the
interaction of the two factors is presented in Figure 34.
Table 21
Summary of
Hierarchical Regression Analysis for Current Health, N = 100
Step
|
Variable
|
ΔR2
|
β
|
b
|
1
|
r
Factor
|
.04*
|
-.14
|
-.14
|
2
|
K Factor
|
.04*
|
.22
|
.22*
|
3
|
Interaction
|
.00
|
-.04
|
-.05
|
Intercept
|
3.98
|
Note: Standardized (β)
and unstandardized (b) coefficients are from the final model (i.e., after Step
3). ΔR2 values are provided for each
predictor as they were entered in consecutive steps. The overall model was significant,
R2 = .09, F(3,96) = 3.16, p < .05. *p < .05

Age at first sexual intercourse.
To examine
the contribution of the r Factor, the K Factor, and their interaction to
explain age at first sexual intercourse, a hierarchical multiple regression
analysis was performed. For sexually active participants (N = 92), the r Factor was entered in the first step, the K Factor
was entered in the second step, and step three included the Interaction
variable (r Factor X K Factor). The results of step three
indicated that the variance accounted for (R2)
with the variables entered equaled .10 (adjusted R2 = .07), which was
significantly different from zero, F
(3, 88) = 3.40, p = .02. The unstandardized regression
coefficients (b) and the intercept, and the standardized regression
coefficients (β) are reported in Table 22. A graph illustrating the
interaction of the two factors is presented in Figure 35.
Table 22
Summary of
Hierarchical Regression Analysis for Age at First Sexual Intercourse, Not
Active Participants Removed, N = 92
Step
|
Variable
|
ΔR2
|
β
|
b
|
1
|
r
Factor
|
.01
|
-.02
|
-.04
|
2
|
K
Factor
|
.10**
|
.31
|
.79**
|
3
|
Interaction
|
.00
|
-.04
|
-.12
|
Intercept
|
16.72
|
Note: Standardized (β)
and unstandardized (b) coefficients are from the final model (i.e., after Step
3). ΔR2 values are provided for each
predictor as they were entered in consecutive steps. The overall model was significant,
R2 = .10, F(3,88) = 3.40, p < .05. ** p < .01
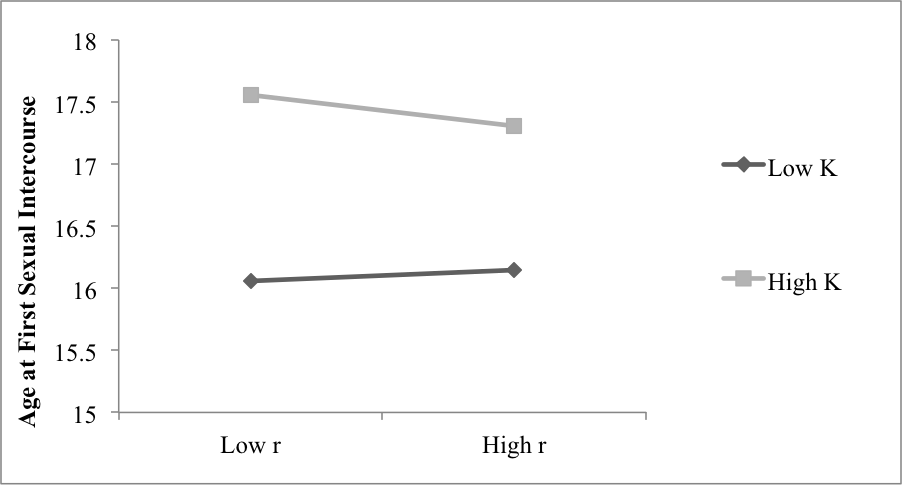
Discussion
Life History Strategies
LHT suggests that since an individual’s resources are
limited, the individual must choose
between r and K strategies; the individual must choose to invest in their offspring or not, put off mating or not,
and have few or many offspring (Kruger & Nesse, 2004, 2006). According to
LHT, a continuum for humans exists from a slower course, high K, to a faster
course, low K (Bielby et al., 2007; Ellis et al.,
2009). These choices in strategy manifest in behaviors existing within
two clusters; mating strategies form a continuum, with most individuals falling
somewhere along this range (Figueredo et al., 2004).
The assumption, however, that an individual’s resources are limited, forcing
them to choose between traditional r and traditional K strategies has been
challenged. It is reasonable to think that individuals with limited resources
are forced to choose between r and K strategies, but individuals that have
plentiful resources might be able to exhibit traditional r and traditional K
strategies.
It was proposed that the traditional view of the K strategy
be maintained with respect to future time perspective, and long-term mating strategy.
Concurrently, sexual drive, sexual desire, sexual flexibility, and lack of
sexual restraint (Figueredo et al., 2006) should be removed from K and placed
on a separate factor; this second factor could be described as r. It was
predicted that sexual clusters of behavior are sex drive, attitudes towards
sex, sexual excitability, and sexual sensation seeking; those behaviors also
lie on a continuum. Individuals can be low in sexual restraint (r) or high,
just as much as they can be high or low on the K spectrum. These sexual
clusters of behavior should load on one factor.
Results of a two-factor solution on life history strategies
scales supported this hypothesis. As observed in the
factor-loading matrix presented in Tables Four and Five, the scales assessing
sexual behaviors (r) loaded strongly on the first factor (Sociosexuality, Brief
Sexual Attitudes Permissiveness, Sexual Sensation Seeking, Sexual Desire
Inventory Solitary, and Sexual Desire Inventory Dyadic) and subsequently
loaded weakly or negatively on the second factor, which is comprised of scales
assessing non-sexual behaviors (K; Mini-K, HKSS, and Future Orientation).
Likewise, the scales assessing non-sexual behaviors (K) loaded strongly on the
second factor and also loaded weakly or negatively on the first factor; this
pattern of loadings illustrates the distinct and separate nature of these two
factors. In addition, results from the factor correlation matrix also revealed
these two factors are distinct, r = -.18.
This two-factor solution does account for individuals that
exhibit high K strategies in non-sexual clusters of behavior while exhibiting
traditional r (low K) strategies in sexual clusters of behavior. To measure
life history strategy on one continuum, as done previously, with sexual and
non-sexual clusters of behavior within the single continuum does not reveal the
whole picture of human life. First, to evaluate a
two-factor solution of life history strategies, I attempted to predict
contraceptive behaviors.
Effectiveness Score
Dual method users and
single method users. Results
did reveal that participants reporting the use of more than one method (dual
users) had higher effectiveness scores, on all three variations of measurement,
than participants reporting the use of only one method (see Tables 8 and 9). As
a check of validity, it appears that dual users have increased contraceptive
skills, contraceptive knowledge, and use more effective methods overall. Participants
could also denote if they were dual method users (e.g., pill and condom,
vaginal ring and condom, etc.).
The majority of participants were single method
users (N = 208), while 68 participants reported being dual method users.
Fascinatingly, many participants reported using the withdrawal method in
addition to other methods listed in the Current or Recent Methods on the CMQ (N
= 68). Future research might look to explore this result, since 25 percent
of participants were reporting this variation of “dual” methods. Future
research might also look to explore the particular cognitions behind this
pattern of behavior: are individuals withdrawing because they do not trust
their primary method? Do they not understand how their method works? Or are
they a method they believe to be reliable and effective? Furthermore, future research
might tease apart individuals who self-identify as dual method users, when in
fact, they are using the withdrawal method instead of the traditionally
accepted condom method in conjunction with another method.
Contraceptive Effectiveness
It was
hypothesized that an interaction between r and K strategies will be found to
predict contraceptive method
effectiveness, such that high r and high K women utilized the most effective
methods. The results revealed a trend in the hypothesized direction (see Table
1); although underpowered, high r and high K women utilized the most effective
methods (see Figure 1). With continued collection of data, this interaction
between r and K will be supported. The methodology used in the current study was
brand new; no previous literature has examined a composite of individuals’
contraceptive use skills, contraceptive knowledge, and their contraceptive
method as an index of their contraceptive effectiveness. Prior research has
examined various demographic variables to explain why women won’t use
contraception (Nettleman et al., 2007), their level of commitment to preventing
pregnancy (Bartz et al., 2007), or inconsistent use of contraception (Davies et
al., 2006); however, no previous research has examined the weight of three
variables that might help explain an individual’s contraceptive behaviors. The
results, although in the hypothesized direction, lacked significance. This
could be due to a myriad of issues caused by lack of power and the new
measurement procedure. Future research will hopefully include a more
comprehensive review of each user and their contraceptive behaviors. Hopefully
future research will aid in progressing this avenue of measurement forward,
specifically in addressing a contracepting individual wholly: by examining
their use skills, knowledge, and choice of method in order to fully understand
their contraceptive behaviors. More comprehensive information in this manner
might lend to contraceptive education reform and expand what we know about
contraception overall.
Contraceptive Knowledge
It was
hypothesized that an interaction between r and K strategies would be found to
predict contraceptive
knowledge, such that high r and high K women would be most knowledgeable about
contraception. The results revealed a trend in the hypothesized direction;
although lacking significance due to being underpowered, high K, high r
participants were the most knowledgeable of contraception.
However, participants in this sample did not score well on
the 21-point multiple-choice examination assessing contraceptive knowledge; the mean score was 12.40 (SD = 2.66). This lack of statistical support could also be due to
the nature of these questions; the presence of a multiple choice test embedded
within self-report measures might be responsible for error, since this method
of measurement was in contrast with what individuals expect when participating
in survey research. However, this result does highlight the necessity for more
comprehensive sex education.
This is not to say that individuals’
contraceptive knowledge should not be taken into account when assessing their
contraceptive behaviors. Questions on the General Knowledge of Contraception
Scale included items that were general in nature: “a woman can get pregnant”
with the options: “(a) a few minutes after sexual intercourse; (b) a few hours
after sexual intercourse; (c) a few days after sexual intercourse, (d) all of
the above.” These questions are not specific to any method, but to the
consequences of sexual intercourse in general; thus, irrespective of the
participant’s method, they should be able to answer these questions to the best
of their knowledge. In addition, the Contraceptive Knowledge Measure included
items for each of the four main methods (pill, IUD, ring, and condom); those
individuals using these specific methods might more easily answer these
questions. In conclusion, this specific population might not have the
contraceptive knowledge to replicate previous findings (e.g., Frost et al., 2012).
General Contraceptive Attitudes
It was hypothesized that an interaction between r and K strategies
would be found to predict general attitudes towards contraceptives, such that high r, high K
women would have the most positive attitudes. Results did not fully support my third hypothesis. Instead,
only the K factor was a statistically significant
predictor, inversely, of general attitudes towards contraception. Participants high on the K factor did
not have nearly as favorable general attitudes towards contraception than their
low K counterparts. However, of high K participants, high r individuals were
more favorable towards contraception. Hopefully more participants might reveal
a clearer picture regarding general attitudes towards contraception.
Contraceptive Morality Attitudes
It was hypothesized that an interaction between r and K strategies
would be found to predict morality attitudes towards contraceptives, such that high r, high
K women would be the most morally accepting of contraceptives. The results revealed a trend in
the hypothesized direction; although underpowered, high r and high K women were
the most morally approving of contraception. Contraceptives are methods that prevent
pregnancy, consequences of the behavior high r, high K individuals engage in
more freely than their counterparts.
Contraceptive Self-Efficacy
It was hypothesized that an interaction between r and K strategies
would be found to predict contraceptive self-efficacy, such that high r, high K women would
have the highest contraceptive self-efficacy. Results from single users did not fully support my fifth
hypothesis, but were trending in the hypothesized direction. High r, high K participants had the
highest contraceptive self-efficacy. Along with more data to reveal the
relationship of the two factors with contraceptive self-efficacy, it might be
more pertinent to examine the individual’s reported behaviors (as seen the CUQ)
as an index of their contraceptive self-efficacy, rather than the measure at
hand. With that, future research might also look to examine if participants’
contraceptive effectiveness scores can predict their contraceptive
self-efficacy, or vice versa.
Life History Outcomes
In order to examine the notion and efficacy of a
two-factor solution of life history strategies, I also attempted to predict
relevant life history outcomes.
Age. For age, a significant interaction was
found between the r Factor and the K Factor. There was a greater gap in age
between high r individuals than low r individuals; furthermore, high r, high K
individuals were the oldest in the sample. Furthermore, it seems in this
sample, high K females endorsed sexual clusters of behavior more as they
mature.
It is also interesting to examine that
individuals low on the K Factor were the youngest; perhaps the K strategy is
indicative of overall maturity. Individuals low on the K Factor can be aggressive, rarely cooperate,
rarely engage in altruistic behaviors, disregard of social rules, manipulative,
exploitative, short term oriented; all of which can be viewed as individuals
lacking maturity.
Religiosity. Results of a nearly significant
interaction revealed low K, high r participants were the least religious, while
high K, low r participants were the most religious. Figueredo and others (2006), as
traditionally measured, high K individuals are more likely to be high on
religiosity, and these results confirm that notion. Interestingly, Figueredo
and others (2006) also note that indicators of sexual restrictedness include
increased religiosity; the negative direction of the r Factor in predicting
religiosity supports this notion directly, the more a participant endorses
sexual unrestrictedness, the lower they report their religiosity. Although the
interaction was not nearly significant, these results highlight the interplay
between the two-factor solution to help explain relevant life history outcomes
such that high r, high K participants were less religious than low r, low K
participants.
Sex frequency in past
year.
Single method users.
Results, although almost
significant, were trending in the hypothesized direction; high r, high K
participants had the highest sex frequency in the past year. This result acts
as a validity check for using the two-factor solution in measuring life history
strategies. It is apparent that individuals endorsing sexual clusters behaviors
would also engage in sexual intercourse more frequently. Interestingly, for all
participants and single users, the K factor was not a significant predictor in
sexual intercourse frequency in the past year. This lack of predictive ability
with respect to a pivotal and relevant life history outcome highlights the need
for two-factor solution measuring life history strategies. Simply being low on
K factor does not reveal an individual engages in sexual variety, sexual
promiscuity, and unrestrained sexuality (as viewed in the traditional model of
measurement); instead, their scores on the r Factor significantly predicted
this relevant life history outcome.
Dual
method users. Results from sexually active dual users revealed stronger support
for a two-factor solution compared to that of single method users, in spite of
the fact that this group had a low sample size (n = 25). A nearly significant interaction revealed high r, high K
participants had the most sex in the past year. These results still support the two-factor
solution for measuring life history strategies. Furthermore, sexual frequency
was highest for high r, high K dual method users, suggesting that the
combination of high sex drive from the r Factor and safer sex from the K Factor
makes for a high frequency of sex!
Age at first sexual
intercourse. Results
from sexually active participants, lacking significance, were in the predicted
direction, such that high r participants were younger at age of first sex.
However, it might be more pertinent to examine the time elapsed between
menstruation and age at first sexual intercourse as a more relevant life
history outcome, rather than these two events in isolation.
Delay of sexual
intercourse. Delay
of Sex was computed by subtracting age at first menstruation from age at first
sexual intercourse. Age at first menstruation did not yield significant results
upon analysis, but delay of sexual intercourse did show support for the
two-factor solution.
Results from sexually active participants, although not significant, revealed
participants higher on the r Factor did not delay sex long after first
menstruation; however, individuals lower on the K Factor delayed sex longer
than their high K counterparts. These
results are fascinating in that they support the notion of utilizing a
two-factor solution to measure relevant life history outcomes; with more data,
the interaction between the two factors should become clearer.
Possibility of being
infertile. Results
revealed a main effect for the K factor. Individuals high on the K factor were
less likely to hold the belief that they were infertile. This is an interesting
result in that it highlights the nature of the K factor. The K factor is
concerned with extensive
parental investment and intensive offspring investment, both of which are
indicative of an individual being able to successfully bear children. This is
not to say that they are engaging in the proximate act of sexual intercourse,
but they hold the belief that they are not likely to have issues with
conception. Interestingly, as measured traditionally, individuals low on K are
seen to have increased fecundity; this might be true in reality, however, the
results of the current study report that individuals high on K perceive
themselves as having higher fecundity than their low K counterparts.
Current health. Results revealed a main effect for the
K factor. Individuals high on the K factor reported being more healthy than their low K
counterparts. This result supports the traditional view of measuring life
history strategies. The K strategy involves clusters of behavior that are
indicative of increased health: extensive
parental investment, consideration of risks, long lifespan, increased inclusive
fitness, extensive somatic investment, and long-term thinking.
Limitations
In the current study, the lack of power
was attributed to the response rate, which was well below 50%; this also contributed
to the ever-fluctuating sample sizes for each of the scales utilized. Due to
using both convenience sampling, in which participants were not rewarded for
their participation, and a human subjects pool, in which participants were
rewarded for participation, the attrition from participants not receiving
compensation was high. Furthermore, the sheer number of items required of the
participants also led to a higher attrition rate for individuals participating
without compensation. Furthermore, oversight in measurement construction lead
to condom users responding to five questions about their method specific use
skills, pill and ring users responding to two questions, IUD users responding
to one, and individuals not utilizing these methods answered none.
Future Directions
More data will be collected to not only
flesh out the interaction between the r Factor and K Factor for the
hypothesized contraceptive results that were not significant, but also to
reveal their relationship with the relevant LH outcomes explored as well. The
next step in improving the overall experimental design at hand is to modify,
shorten, and clarify the scales used to assess the participant’s life history
strategy and contraceptive behaviors. However, this study lays foundational
groundwork on what dimensions comprise an individuals sexual clusters of
behavior (r Factor) and non-sexual clusters of behavior (K Factor); future
psychometric work can improve and streamline the measurement of these
two-factors solution for life history strategies. Factor analyses and
reliability analyses should be ran item level to determine what items are the
best indicators of each strategy; these items could be used to create a short
form for assessing these two strategies. Furthermore, refinement of measurement
of contraceptive effectiveness can be made, due to the initial work of the
current study. Future studies will hopefully fine-tune the assessment of an
individual’s actual contraceptive behavior, either by utilizing an
observational method (e.g., Lindemann & Brigham, 2003) or more detailed
self-reports specific to their contraceptive method, either in Likert-scale or
free-response fashion. Likewise, questions should be constructed for methods
outside the primary four, as utilized in the current study.
Conclusion
Seventy seven percent of participants in this
sample reported using a contraceptive method, while only 23 percent reported no
method. These results shed initial light on how individuals can pursue both an
r and K strategy. The
resource that allows individuals to pursue both traditional r and traditional K
strategies is contraception. Life history theory, in its purest form, is
concerned predominantly with the timing of reproduction, since that is the
final stage organisms can allocate resources to in their lifetime (Griskevicius
et al., 2011). The question of how individuals time their reproduction is
raised: they use contraception.
Current measures of life history strategies are not
comprehensive and problematic: to ask someone if they endorse long-term mating (e.g.,
the Mini-K, Figueredo et al., 2006) doesn’t provide a representative summary of
the clusters of behaviors indicative of their life history strategy,
specifically strategies signifying the timing of their reproduction. Instead,
it would be much more pertinent to ask individuals more specifically about
their sexual restraint, or lack thereof, and their contraceptive behaviors.
These two facets might reveal a more realistic index of what life history
strategy they are employing. Because life history, biologically and
psychologically, really is about reproductive timing (Griskevicius et al.,
2011): it takes sex to reproduce and it takes contraception to prevent it. The questions individuals should be asked are
more along the lines of: do you want to reproduce, and when? Do you want to
prevent pregnancy, and what length do you go to prevent pregnancy? How well do
you prevent reproduction, and how often do you engage in intercourse (the act
of reproduction)? These behaviors are indicative of a life history strategy, as
it relates to the theory it was originally distilled from (Promislow &
Harvey, 1990, 1991).
It is through the use of contraception females can pursue a
mixed strategy of combining both r and K strategies. Although women have been
practicing contraception since they could keep written records, it was only
recently that highly effective hormonal methods allowed women to virtually
perfect their contracepting behaviors (Szarewski & Guillebaud, 1991). Since
sex with contraception lowers the risk of pregnancy, women can combine r and K
strategies. High K specific strategies such as high personal investment
(attending a university, pursuing a career, etc.), delay of reproduction, and
increased investment in offspring quality with birth spacing can be achieved by
utilizing an effective form of contraception. However, these women can also
engage in a high frequency of intercourse both inside and outside the context
of relationships, a strategy often displayed by high r individuals.
Contraception makes it possible for an individual to begin
sexual activity at an early age while investing in self-development (e.g.,
pursuing a college degree), to have sex with multiple partners without
conception, choose one long-term partner (with or without non-conception extra
pair copulation), and invest heavily in a limited number of children (due to
contraception’s child spacing and limiting benefits). Through contraception, females can pursue
promiscuous or committed sex; females can have as much sex without conception
as desired; and consequently, enjoy sex proximately without the ultimate
consequence of pregnancy. The results of the study support this notion.
Specifically, the majority of participants were employing a contraceptive
method (80%), the majority of participants are sexually active and the average
age at first sex was 15.54, 43.2 percent of participants in the current study
were dating exclusively, and no participants (in analysis) were pregnant. Furthermore,
96.8% of participants in analysis did not have children and 96.8% have not had
an abortion; the combining of the r and K strategies seems to be successful in
terms of reproductive consequences.
To conceptualize life history strategies in this manner before
might have been difficult. Similarly, we know knowledge is a predictor of
contraceptive use; so if individuals could gain more knowledge about
contraception, they could effectively change their strategy under this theory
and might actually be successful (Frost et al., 2012). However, according to
Kaplan and Lancaster (2003), “anthropological research among small-scale
societies reveals that with increasing resources and increasing investment in
embodied capital, people choose to have fewer children, and they choose to have
them later.” The resources could not only indicate shifting from low K to high
K, but those resources could be access to and implementation of safe and
effective contraception. Through contraception, these individuals can be
successful in having fewer children and having them later in life, other
indicators of high K strategies. This is not to say that one strategy is better
than others, even while some say one is more “socially desirable” (Figureredo
et al., 2006). Nonetheless, when it comes to global overpopulation and carrying
capacity (Ehrlich & Ehrlich, 2013), maternal mortality (Esscher, Högberg, Haglund, & Essën,
2013; Storeng, Drabo, Filippi, 2013), AIDS/HIV (Kanki, 2013), limited access to
contraception (Dennis et al., 2012), threats to access (Horga, Gerdts, &
Potts, 2013), in terms of reproductive timing: the right combination of each
strategy is better.
References
Alexander, R. D. (1987). The
biology of moral systems. Hawthorne, NY: Aldine de Gruyter.
Apt, C. &
Hurlbert, D. F. (1992). Motherhood and female sexuality beyond one year
postpartum: A study of military wives. Journal of Sex Education and Therapy,
18,104-1
Arneklev, B.J., Cochran, J.K.,
& Gainey, R.R. (1998). Testing Gottfredson and Hirschi’s ‘low self-control’
stability hypothesis: An exploratory study. American
Journal of Criminal Justice, 23, 107-127.
Arneklev, B.J., Grasmick, H.G., Tittle,
C.R., & Bursik, R.J. (1993). Low self–control and imprudent behavior. Journal
of Quantitative Criminology, 9, 225-247.
Bartz, D., Shew, M.,
Ofner, S., & Fortenberry, J.D. (2007). Pregnancy intentions and
contraceptive behaviors among adolescent women: A coital event level analysis. Journal of Adolescent Health, 41(3),
271-276.
Benagiano, G.,
Bastianelli, C., & Farris, M. (2007). Contraception: A social revolution. The European Journal of Contraception and
Reproductive Health Care, 12(1), 3-12.
Benagiano, G.,
Carrara, S., & Filippi, V. (2010). Sex and reproduction: An evolving
relationship. Human Reproduction Update,
16(1), 96-107. doi: 10.1093.humupd/dmp028
Bielby, J., Mace, G. M.,
Bininda-Emonds, O. R. P., Cardillo, M., Gittleman, J. L., Jones, K. E.,…Purvis,
A. (2007). The fast–slow continuum in mammalian life history: An empirical
reevaluation. The American Naturalist, 169, 748–757. doi:10.1086/516847
Black, K.J., &
Pollack, R.H. (1987, April). The
development of a contraceptive attitude scale. Paper presented at the
Annual Meeting of the Southern Society for Philosophy and Psychology, Atlanta.
Brumbach, B.H.,
Walsh, M., & Figueredo, A.J. (2007). Sexual restrictedness in adolescence:
A life history perspective. Acta Psychologica Sinica, 39(3),
481-488.
Buhi, E.R.,
Marhefka, S.L., & Hoban, M.T. (2010). The state of the union: Sexual health disparities in
a national sample of US college students. Journal
of American College Health, 58(4), 337-346.
Carver, C. S., & White, T. L. (1994). Behavioral
inhibition, behavioral activation, and affective responses to impending reward
and punishment: The BIS/BAS scales. Journal of Personality and Social
Psychology, 67, 319-333.
Centers for Disease Control and
Prevention. (2009). Bridged-race population estimates, no date, http://wonder.cdc.gov/bridged-race-v2009.html,
accessed September17, 2012.
Condelli, L. (1984).
A unified social psychological model of contraceptive behavior. Unpublished
doctoral dissertation, University of California, Santa Cruz.
Condelli, L. (1986). Social and
attitudinal determinants of contraceptive choice: Using the health model. The Journal of Sex Research, 22, 478-491
Cosmides, L. & Tooby, J.
(2000). Evolutionary psychology and the emotions. In Lewis, M. &
Haviland-Jones, J.M. (Eds.). Handbook of
Emotions, 2nd Edition (91-115). New York, NY: Guilford.
Daan, S., & Tinbergen, J.
(1997). Adaptation of life histories. In J. R. Krebs & N. B. Davies (Eds.),
Behavioural Ecology: An evolutionary approach (4th ed., pp. 311–333).
Oxford, England: Blackwell.
Davies, S.L.,
DiClemente, R.J., Wingood, G.M., Person, S.D., Dix, E.S., Harrington, K.,
Crosby, R.A., & Oh, K. (2006). Predictors of inconsistent contraceptive use
among adolescent girls: Findings from a prospective study. Journal of Adolescent Health, 39(1), 43-49.
Darwin, C. (1859).
On the Origin of Species by Means of Natural Selection, or the Preservation of
Favoured Races in the Struggle for Life, 1st Ed. London: John
Murray.
de Waal, F. B. M.
(1987). Tension regulation and non-reproductive functions of sex in captive bonobos (Pan
paniscus). National Geographic
Research Reports, 3, 318-335.
Dennis, A., Clark,
J., Cordova, D., McIntosh, J., Edlund, K., Wahlin, B., Tsikitas, L., &
Blanchard, K. (2012). Access to contraception after health care reform in
Massachusetts: A mixed-methods study investigating benefits and barriers. Contraception, 85(2), 166-172. doi: http://dx.doi.org/10.1016/j.contraception.2011.06.003
Eisenberg, D.L., Allsworth,
J.E., Zhao, Q., & Peipert, J.F. (2010). Correlates of dual-method
contraceptive use: an analysis of the National Survey of Family Growth
(2006–2008), Infectious Diseases in Obstetrics and Gynecology, 2012, 1-6. doi:10.1155/2012/717163.
Ellis, B. J., Figueredo, A. J.,
Brumbach, B. H., & Schlomer, G. L. (2009). Fundamental dimensions of
environmental risk: The impact of harsh versus unpredictable environments on
the evolution and development of life history strategies. Human Nature, 20, 204–268.
doi:10.1007/ s12110-009-9063-7
Ehrlich, P.R. & Ehrlich,
A.H. (2013) Can a collapse of global civilization be avoided? Proc. R. Soc. B., 280(1754), doi:10.1098/rspb.2012.2845
Ersek, J.L., Brunner Huber,
L.R., Thompson, M.E., & Warren-Findlow, J. (2011). Satisfaction and
discontinuation of contraception by contraceptive method among university
students. Maternity and Child Health
Journal, 15, 497-506.
Esscher, A., Högberg, U., Haglund, B., & Essën, B. (2013). Maternal mortality in Sweden
1988-2007: More deaths than officially reported. Acta Obstet Gynecol Scand, 92. 40-46. doi: 10.1111/aogs.12037
Figueredo,
A.J., Vásquez, G., Brumbach, B.H., & Schneider, S.M.R. (2004). The
heritability of life history strategy: The K-factor, covitality, and
personality. Social Biology, 51, 121-143.
Figueredo, A. J.,
Vásquez, G., Brumbach, B. H., Schneider, S., Sefcek, J. A., Tal, I. R., Hill,
D., Wenner, C.J., & Jacobs, W.J. (2006).Consilience and life history
theory: From genes to brain to reproductive strategy. Developmental Review, 26, 243–275.
Finer, L.B., &
Henshaw, S.K. (2006). Disparities in rates of unintended pregnancy in the
United States, 1994 and 2001. Perspectives
on Sexual and Reproductive Health, 38(2), 90-96.
Fisher, W.A., Byrne,
D., Edmunds, M., Miller, C.T., Kelley, K., & White, L.A. (1979).
Psychological and situation-specific correlates of contraceptive behavior among
university women. The Journal of Sex
Research, 15, 38-55.
Forrest, J.D., &
Frost, J.J. (1996). The family planning
attitudes and experiences of low-income women. Family Planning Perspectives, 28(6), 246–255 & 277.
Frost, J.J., &
Darroch, J.E. (2008). Factors associated with contraceptive choice and
inconsistent method use, United States, 2004. Perspectives on Sexual and Reproductive Heath, 40(2), 94-104.
Frost, J.J., Henshaw, S.K., &
Sonfield, A. (2010) Contraceptive
needs and services: National and state data, 2008 Update. New York:
Guttmacher Institute. Retrieved from http://www.guttmacher.org/pubs/win/contraceptive-needs-2008.pdf
Frost, J.J.,
Lindberg, L.D., & Finer, L.B. (2012). Young
adults' contraceptive knowledge, norms and attitudes: associations with risk of
unintended pregnancy. Perspectives
on Sexual and Reproductive Health, 44(2), 107–116.
Gadgil, M. & Bossert, W. H.
(1970). Life historical consequences of natural selection. American Naturalist, 104, 1-24.
Gaydos, L.M., Neubert, B.D.,
Hogue, C.J., Kramer, M.R., & Yang, Z. (2010). Racial disparities in
contraceptive use between student and nonstudent populations. Journal of Women’s Health, 19(3),
589-595.
Gillespie, D.O.S., Russell, A.F.
& Lummaa, V. (2008). When fecundity does not equal fitness: Evidence of an
offspring quantity versus quality trade-off in pre-industrial humans. Proceedings of the Royal Society B:
Biological Sciences, 275, 713–22. doi:10.1098/rspb.2007.1000
Giosan, C. (2006).
High-K strategy scale: A measure of the high-K independent criterion of
fitness. Evolutionary Psychology, 4, 394-405.
Glander, K.E.
(1994). Nonhuman primate self-medication with wild plant foods. In Etkin, N.L.
(ed.), Eating on the Wild Side (227-239).
Tucson, AZ: The University of Arizona Press.
Gold, R.B.,
Sonfield, A., Richards, C.L., & Frost, J.J. (2009). Next steps for America’s family planning program: Leveraging the
potential of Medicaid and Title X in an evolving health care system. New
York: Guttmacher Institute. Retrieved from http://www.guttmacher.org/pubs/NextSteps.pdf
Griskevicius, V., Delton, A.W.,
Robertson, T.E., & Tybur, J.M. (2011). Environmental contingency in life
history strategies: The influence of mortality and socioeconomic status on
reproductive timing. Journal of Personality and Social Psychology, 100(2),
241-254. DOI: 10.1037/a0021082
Harvey, S.M.,
Beckman, L.J., & Wright, C. (1997). Perceptions and use of the male condom
among African American university students.
International Quarterly of Community Health Education, 16(2), 139–153.
Hayes, S.L. &
Carpenter, B.L. (2010) Absence of malice: Constructing the female sex offender. In Moral Panics in the Contemporary World. London, UK: Brunel
University. (Unpublished)
Hendrick, C.,
Hendrick, S.S., & Reich, D.A. (2006). The brief sexual attitudes scale. The Journal of Sex Research, 43(1), 76-86
Hill, K. (1993). Life history
theory and evolutionary anthropology. Evolutionary Anthropology, 2, 78–88.
doi: 10.1002/evan.1360020303
Horga, M., Gerdts, C., &
Potts, M. (2013). The remarkable story of Romanian women’s struggle to manage
their fertility. Journal of Family
Planning and Reproductive Health Care, 39(1), 2-4. doi: doi:
10.1136/jfprhc-2012-100498.
Jones, R.K. (2011). Beyond
Birth Control: The Overlooked Benefits of Oral Contraceptive Pills.
New York: Guttmacher Institute. Retrieved from http://www.guttmacher.org/pubs/Beyond-Birth-Control.pdf
Juhasz, A.M., & Kavanagh,
J.A. (1978). The chain of sexual decision-making. The Family Coordinatior, 24, 43-49.
Kalichman, S.C., Adair, V.,
Rompa, D., Multhauf, K., Johnson, J., & Kelly, J. (1994). Sexual
sensation-seeking: Scale development and predicting AIDS-risk behavior among
homosexually active men. Journal of
Personality Assessment, 62, 385-397.
Kalichman, S. C,
& Rompa, D. (1995). Sexual sensation seeking and sexual compulsivity
scales: Reliability, validity, and predicting HIV risk behaviors. Journal of
Personality Assessment, 65, 586-602.
Kanki, P.J.
(2013) HIV/AIDS global epidemic. In Kanki, P. & Grimes, D.J. (eds.), Infectious Diseases (27-62). New York,
NY: Springer.
Kaplan, H.S., & Gangestad,
S.W. (2005). Life history theory and evolutionary psychology. In D.M. Buss
(Eds.), Evolutionary Psychology Handbook.
New York: Wiley.
Kaplan, H. S., & Lancaster,
J. B. (2003). An evolutionary and ecological analysis of human fertility,
mating patterns, and parental investment. In K. W. Wachter & R. A. Bulatao
(Eds.), Offspring: Human fertility behavior in biodemographic perspective (pp.
170 –223). Washington, DC: National Academies Press.
Kaplan, H. S., Hill, K.,
Lancaster, J. L., & Hurtado, A. M. (2000). A theory of human life history
evolution: Diet, intelligence, and longevity. Evolutionary Anthropology, 9, 156 –185. doi:10.1002/1520-6505
(2000)9:4156::AID-EVAN53.0.CO;2-7
Kost, K., Singh, S., Vaughan,
B., Trussell, J., & Bankole, A. (2008). Estimates
of contraceptive failure from the 2002 National Survey of Family Growth. Contraception, 77(1), 10–21.
Kowaleski-Jones, L.,
& Mott, F.L. (1998). Sex, contraception and childbearing among high-risk
youth: Do different factors influence males and females? Family Planning Perspectives, 30(4),163-169.
Kruger, D. J., and
Nesse, R. M. (2004). Sexual selection and the male : female mortality ratio. Evolutionary
Psychology, 2, 66-85.
Kruger, D. J., and
Nesse, R. M. (2006). An evolutionary life-history framework for understanding
sex differences in human mortality rates. Human Nature, 17, 74- 97.
Lack, D. (1947) The significance
of clutch-size. Ibis, 89, 302–352.
Lack, D. (1950). The breeding
seasons of European birds. Ibis, 92, 288– 316.
doi:10.1111/j.1474-919X.1950.tb01753.x
Lawson, D.W., Alvergne, A.,
& Gibson, M.A. (2012). The life
history trade-off between fertility and child survival. Proceedings of the Royal Society B: Biological Sciences, 00, 1-10.
doi:10.1098/rspb.2012.1635
Levinson, R. A.
(1986). Contraceptive self-efficacy: A perspective on teenage girls’
contraceptive behavior. Journal of Sex Research, 22, 347-369.
Li, R.H.W., &
Lo, S.S.T. (2005). Evolutionary voyage of modern birth control methods. Hong Kong Journal of Gynecological
Obstetrics and Midwifery, 5(1), 40-45.
Lindemann, D. F. & Brigham, T. A. (2003). The
Measure of Observed Condom Use Skills (MOCUS). AIDS and Behavior,
7, 23-27.
Mace, R. (2000).
Evolutionary ecology of human life history. Animal
Behavior, 59, 1-10.
Meena, A. K., &
Rao, M. M. (2010). Folk herbal medicines used by the Meena community in
Rajasthan. Asian Journal of Traditional
Medicines, 5(1), 19-31.
Mosher, W.D., & Jones, J.
(2010). Use of contraception in the United States: 1982–2008, Vital and
Health Statistics, 23(29), 1-45.
Nettleman, M.D.,
Chung, H., Brewer, J., Ayoola, A., & Reed, P.L. (2007). Reasons for
unprotected intercourse: Analysis of PRAMS survey. Contraception, 76(5), 361-366.
Pillard, C.T.
(2007). Our other reproductive choices: Equality in sex education,
contraceptive access, and work-family policy. Emory L.J., 56, 941-991.
Polis, C.B., &
Zabin, L.S. (2012). Missed conceptions or misconceptions: Perceived infertility
among unmarried young adults in the United States. Perspectives on
Sexual and Reproductive Health, 44(1), 30-38. doi: 10.1363/4403012
Promislow, D. E. L., and Harvey,
P. H. (1990). Living fast and dying young: A comparative analysis of
life-history variation among mammals. Journal
of Zoology, 220, 417-437.
Promislow, D. E. L., and Harvey,
P. H. (1991). Mortality rates and the evolution of mammal life histories. Acta Oecologica,12, 119-137.
Quinlan, R. J. (2007). Human
parental effort and environmental risk. Proceedings of the Royal Society B:
Biological Sciences, 274, 121–125. doi:10.1098/rspb.2006.3690
Raine, T., Minnis,
A.M., & Padian, N.S. (2003). Determinants of contraceptive method among
young women at risk for unintended pregnancy and sexually transmitted
infections. Contraception, 68(1),
19–25.
Rosenberg, M.J.,
Waugh, M.S., & Burnhill, M.S. (1998). Compliance, counseling and
satisfaction with oral contraceptives: A prospective evaluation. Family Planning Perspectives, 30(2),
89–92,104.
Rowe, D. C., Vazsonyi, A.T.,
& Figueredo, A. J. (1997). Mating effort in adolescence: Conditional or
alternative strategy? Personality and
Individual Differences, 23(1), 105-115.
Ryan, C., & Jethá,
C. (2010) Sex at dawn. New York: NY:
HarperCollins Publishers.
Sable, M.R., Libbus,
M.K., & Chiu, J.E. (2000). Factors affecting contraceptive use in women
seeking pregnancy tests: Missouri. Family
Planning Perspectives, 32(3), 124–131.
Sayegh, M.A.,
Fortenberry, J.D., Shew, M., & Orr, D.P. (2006). The developmental
association of relationship quality, hormonal contraceptive choice and condom
non-use among adolescent women. Journal
of Adolescent Health, 39(3), 388-395.
Schick, V.R.,
Zucker, A.N., & Bay-Cheng, L.Y. (2008). Safer, better sex through feminism:
The role of the feminist ideology in women’s sexual well-being. Psychology of Women Quarterly, 32,
225-232. doi: 10.1111/j.1471-6402.2008.00431.x
Shuker, K.P.N.
(2001). The hidden powers of animals: Uncovering the secrets of nature. London,
UK: Marshall Editions.
Simpson, J.A. &
Gangestad, S. (1991). Individual differences in sociosexuality: Evidence for
convergent and discriminant validity. Journal
of Personality and Social Psychology, 60, 870-883.
Skouby, S.O. (2010).
Contraceptive use and behavior in the 21st century: A comprehensive
study across five European countries. The
European Journal of Contraception and Reproductive Health Care, 15(S2), S42-S53.
Strathman, A.,
Gleicher, F., Boninger, D.S., & Edwards, C.S. (1994). The consideration of
future consequences: Weighing immediate and distant outcomes of behavior. Journal of Personality and Social
Psychology, 66, 742-752.
Storeng, K.T.,
Drabo, S., & Filippi, V. (2013). Too poor to live? A case study of
vulnerability and maternal mortality in Burkina Faso. Global Health Promotion,
20(1), 33-38. doi: 10.1177/1757975912462420
Strier, K.B.
(1993). Menu for a monkey. Natural
History, 102, 34-43.
Strier, K.B.
& Ziegler, T.E. (1994). Insights into ovarian function in wild muriqui
monkeys (Brachyteles arachnoides). American Journal of Primatology, 32,
31-40.
Spector, I.P.,
Carey, M.P., & Steinberg, L. (1996). The sexual desire inventory:
Development, factor structure, and evidence of reliability. Journal of Sex and Marital Therapy, 22,
175-190.
Szarewski, A., &
Guillebaud, J. (1991). Contraception. BMJ,
302, 1224-1226.
Tinbergen, J. M., & Both, C.
(1999). Is clutch size individually optimized? Behavioral
Ecology, 10, 504–509. doi:10.1093/beheco/10.5.504
Tooby, J., & Cosmides, L.
(1992). The psychological foundations of culture. In J. Barkow, L. Cosmides,
& J. Tooby (Eds.), The Adapted Mind
(pp. 19-136). New York, NY: Oxford University Press.
Trussell, J. (2011).
Contraceptive failure in the United States, Contraception, 83(5), 397–404.
Trussell, J., & Raymond,
E.G. (2011). Emergency contraception: a last chance to prevent unintended
pregnancy, Princeton: Princeton University. Retrieved from http://ec.princeton.edu/questions/ec-review.pdf
Wasserman, M.D., Chapman, C.A.,
Milton, K., Gogarten. J.F., Wittwer, D.J., & Ziegler, T.E. (2012).
Estrogenic plant consumption predicts red colobus monkey (Procolobus rufomitratus) hormonal state and behavior. Hormones and Behavior, 62(5), 553-562. doi:
10.1016/j.yhbeh.2012.09.005
Wiederman, M.W. (2005). The
gendered nature of sexual scripts. The
Family Journal, 13(4), 496-502. doi: 10.1177/1066480705278729
Williams, C.M.,
Larsen, U., McCloskey, L.A. (2008). Intimate partner violence and women’s
contraceptive use. Violence Against
Women, 14(12), 1382-1396.
Worthman, C. M., & Kuzara,
J. (2005). Life history and the early origins of health differentials. American
Journal of Human Biology, 17, 95–112. doi:10.1002/ajhb.20096